
Customers’ Acceptance Level Of Smart Restaurant Services In Penang

Abstract
Nowadays, the world is changing rapidly, with innovative technology, a new set of challenges need to be considered and addressed. The discussions about using technology in restaurants and food service sector only cover some of the main topics such as information system management and integration, automation, data analytics, and guest-facing technology. However, despite the positive prospects of smart technology in the hospitality industries, they have not been adopted widely in Food and Beverage (F&B) sectors in some Asian or Middle Eastern countries. This study aims to investigate the core motivations for adopting smart restaurant services in developing countries such as Malaysia. The purpose of this study is to explore the relationship between the predictors’ variables such as perceived cost, perceived enjoyment, novelty, and customers’ acceptance level of smart restaurant services as a dependent variable. A research framework is developed based on the extended Technology Acceptance Model (TAM) and Diffusion of Innovation Theory (DOI). The quantitative research approach was applied to the empirical part of this study to test the conceptual model. Therefore, to achieve this purpose, a survey was conducted in Penang, Malaysia. The data was collected from 150 respondents and analysed by SPSS statistical software. The research results indicate that perceived enjoyment (PE) is the most significant predictor in customers’ acceptance of a smart restaurant which is followed by perceived cost (PC). However, Implications of the findings is relevant and helpful to both academia and F&B operators along with future research opportunities with an industrial standard for restaurant entrepreneurs.
Keywords: Smart restaurant services, perceived enjoyment, perceived cost, novelty, Technology Acceptance Model (TAM), Diffusion of Innovation Theory (DOI)
Introduction
Nowadays, hospitality carriers and Food and Beverage (F&B) operators endeavour to search for innovative ways to enhance their business models with sustainable profit and competitive advantages in the existing market. In the current conventional restaurants, most of the service crews are operated separately in ordering, serving, payment procedure and preparing dining ware. Hence, most of the work operations in the kitchen or back-of-house are already implemented with different type of technology devices, which depends on the type of restaurant and operator’s preferences. The rapid advancement of smart technology that provide new innovative features allow F&B entrepreneurs are heavily considered to integrate smart devices in the restaurants, which able to improve the dining services and experiences to attract more customers. However, the implementation of smart technology in the F&B industry required a significant amount of money and time investment. Hence, fully automated restaurant with high-tech equipment is able to serve higher quality food with better hygiene in shorter period while reduce additional workforces.
Furthermore, due to the increment of health awareness among consumers, it is notable that a healthy diet and lifestyle with health improvement goals change the various factors that determined dining decision-making and eating behaviours. Therefore, it is essential for food industries and restaurant operators to develop new business strategies through the integration of healthcare technologies and Nutritional Information (NI), as smart restaurants’ users will able to control their food ordering via the smart menu based on their diet preferences, which recorded in every customers’ ID respectively for future purchase (Mani & Chouk, 2017).
After identifying the smart services characteristics, it is fundamental to have closer look up to the challenges and opportunities of these services. This study used customers’ acceptance approach to empirically show how innovative technology such as smart services affect entrepreneurial outcomes related to restaurant and food industry. The F&B operators as small and medium-size enterprises (SMEs) play the founding and dominant role in the development of new business (Man, Lau, & Snape, 2008). Besides industrial fields, smart restaurant services contain user’s beneficial values of the services into the different part, hedonic, economic, comfortable aspects, security, and privacy risk, which required deeper understanding of services and customers in order to develop and increase the acceptance of popularisation of smart technology (Park, Kim, Kim, & Kwon, 2018). The adoption of smart technology has been analysed using different theatrical model, for instance, the Technology Acceptance Model (TAM) (Davis, 1986). However, with regards to smart restaurant services, the extended TAM ( Hu, Chau, Sheng, & Tam, 1999; Lu, Yu, Liu, & Yao, 2003; Pantano & Di Pietro, 2012; Oliveira, Thomas, Baptista, & Campos, 2016), and Diffusion of Innovation Theory (DOI) (Rogers, 2002; Rogers, 2010; Martins, Oliveira, & Popovič, 2014) used in this research which includes the perceived enjoyment, perceived cost, and novelty as predictor variables that explain the positive or negative influence on intention to use and acceptance.
Problem Statement
The discussion about implementation technology in restaurants and food service sector are mainly cover for topics in information system management and integration, automation, data analytics, and guest-facing technology (Susskind, 2017). The majority of past studies on customers’ acceptance level in smart restaurant and services had been conducted within developed countries such as United States (USA), United Kingdom (UK), Singapore, and even Japan, which limited in developing countries such as Malaysia. Therefore, despite the positive prospects of smart technology in the hospitality industries, it is not been adopted widely in food service sectors and restaurant especially in developing countries. There are plenty of researches have been done on the concept of smart technology, especially smart home design, smart tourism and hotel in the context of Customers’ Acceptance of smart technology. However, there are a few shreds of evidence on the prior studied relevant to smart services in the F&B industry. Hence, it is crucial to study the customers’ perception for all entrepreneurs towards the adoption of smart restaurant and services, which will help to further understand the acceptance barriers and consumers’ behaviour, in order to promote the potential of technology implementation in F&B sector in the near future. One of the significant concerns is to generalise the findings to the smart restaurant services within the whole of Malaysia. Meanwhile, there is also lack of research studies in the investigation on customer acceptance level of smart technology in dining and food services, which allow customers to personalise their dining environment, lighting, ordering meals based on individual preferences, even before step in the restaurant.
Overall, the comprehensive review of prior frameworks illustrates that most of the customers’ acceptance researches adopted the TAM, hence, typically focused on perceived usefulness and perceived ease of use as their predictors which is related to the attitude toward customers’ behaviour and its intention to use. Furthermore, these two variables could be executed for existing technology, but when the new and unknown technology is introduced to the market other predictors such perceived novelty, perceived enjoyment, and perceived cost, need to be considered as well. Some recent studies such as Park et al., (2018), Mani and Chouk (2017), Rind et al. (2017) and Yang, Lee, and Zo, (2017) extended their frameworks with adopting new relevant predictors. Hence, it is important to study the customers’ acceptance level of smart services in the restaurant, which may help to understand the customers’ priority, consciousness, and issues towards the adoption of innovative technology.
Research Questions
Refers to the background of research and existing evidence intent to indicate the benefits of using new technology development in F&B industry. This research attempts to find the answer for the following questions, to illustrate the factors that may influence on customers’ acceptance level of the smart restaurant:
- Is there a significant and positive relationship between Perceived Enjoyment and Customers’ Acceptance level of the smart restaurant?
- Is there a significant and negative relationship between Perceived Cost and Customers’ Acceptance level of the smart restaurant?
- Is there significant and positive relationship between Novelty and Customers’ Acceptance level of the smart restaurant?
Purpose of the Study
In this sense, literature falls short in discussing issues involving smart food services. By investigating the linkage between innovative technology competencies among the food and beverage industry and customers’ acceptance of smart restaurant services in Penang, this study aims to narrow this gap. The comprehensive review of smart technologies with the combination of results is used to address the research objective and gap. This study intends to provide a better understanding of customers’ acceptance level of smart technology in restaurant and food service. Refers to the background of research and existing evidence seek to indicate the benefits of using new technology development and expected to achieve the relationship between hedonic value (perceived enjoyment), economic value (perceived cost) and novelty and customers’s acceptance level of smart services in the F&B industry. Moreover, this study provides the significant insights on how new technology is perceived in the food industry and how it can be effectively adopted to satisfy consumer expectations. The results are able to provide practical guidelines on how to design such technology in the future. Eventually, the implication of this research will help the restaurant entrepreneur and operators how to adopt new technology effectively in order to meet their customers’ expectations.
Eventually, restaurant operators necessarily require to realise that the new consumer behaviour with accepting the new technology such as smart ordering services and personalizing dining environment, which fundamentally can change their business models in unexpected ways. Thus, there is a potential opportunity for any entrepreneurs in F&B industry in Malaysia to further explore the customers’ adoption of smart technology in their business, in order to develop a new comprehensive business model which will enhance the competitive advantages in existing F&B market.
Theoretical background and hypotheses
Technology Acceptance Model (TAM) is the main concept and adoption model of the technology that introduced as the most effective way to estimate the level of success of the services and systems. According to Davis (1986), the original framework of Technology Acceptance Model (TAM) validated as a valuable and useful theoretical model of smart services. From another perspective, Li and Huang (2009) indicated that TAM is not only applied the personal perception and consideration, but also it is able to merge social impacts and experiences to predict customers’ acceptance of smart services. A typical acceptance model was proposed for smart restaurant services integrating ease of use, enjoyment, security and risk control, system reliability, and also cost as the core motivations. Pantano and Di Pietro (2012), investigated a different aspect of TAM with categorising various articles based on the bias of implicit and explicit conceptualisation of TAM. Therefore, they proposed the extended TAM that contains the new variable such as perceived cost, perceived security/risk, self-efficacy, and behavioural control. According to Lai (2017) and Park et al. (2018), hedonic value or perceived enjoyment is related to perceived ease of use after extended original TAM to a new model.
Theory on the Diffusion of Innovation (DOI) implemented in the various study for more than 50 years. This theory generally explains how new idea and practices, especially in technology-oriented model is able to spread within or between any communities (Rogers, 2002; Rogers, 2010). According to Martins et al. (2014), the Diffusion of Innovation Theory (DOI) received fundamental empirical support in explaining customers’ acceptance in several disciplines, especially the novelty and uniqueness of new technology. Moreover, Oliveira et al. (2016) elaborate that with the popularity of smart devices and services need to develop an innovative research model which is combined the Diffusion of innovation Theory with well-known extended TAM plus perceived security. Therefore, the results will reveal the proposed model has good explanatory power in predicting Customers’ Acceptance and intention to use new technology.
Perceived enjoyment and customers’ acceptance Level
Perceived enjoyment is defined as the value that customers receive based on the subject experience of subject playfulness and fun associated with senses, pleasure, and emotions ( Babin, Darden, & Griffin, 1994). The hedonic value such as enjoyment is considered as a reason to attract the customers. In general, hedonic motivation considers as one of the important element to determine technology acceptance. Perceived enjoyment also defines as pleasure and fun that derived from adopting innovative technology (Venkatesh, Thong, & Xu, 2012).On the other word, (Davis, Bagozzi, & Warshaw,1992) indicated perceived enjoyment is intrinsic motivation to use the new technology in contrast to the perceived usefulness and perceived ease of use as extrinsic motivation. The smart restaurant atmosphere can be as a hedonic value that plays role in developing the long-lasting relationship with the customer. Therefore, the impact of ambient restaurant environment condition is considerable toward the customers’ acceptance (Yang et al., 2017). Furthermore, some studies focused on the significant and positive impact of perceived enjoyment on customer acceptance and intention to use smart services ( Igbaria, Schiffman, & Wieckowski, 1994; Park et al., 2018). The hypothesis of this research proposed based on the previously supported the significant and positive relationship between the customers’ acceptance level of smart services and perceived enjoyment concept.
Perceived cost and customers’ acceptance level
Perceived cost symbolises the encoding of the objective selling price of a product or service. Generally, customers are not aware of the actual or estimated cost of the production, or even the factors involved in pricing a product or service, and the actual or estimated costs of production (Kim, Chan, & Gupta, 2007). Perceived cost is related to the customers’ feeling about the price of service or product (Zeithaml, 1988). Customers typically attempt to compare the cost of the service and benefits of that and also defined as the essential concern related to the value of purchasing. However, Mani and Chouk (2017) believed that the value of new service and product have a significant impact on customers’ acceptance of smart service. Venkatesh et al., (2012), followed the ideas that the pricing structure have a significant impact on customers’ acceptance. According to Park et al., (2018) one of the largest barriers to diffusion the smart services is the cost aspect and there is a negative correlation between cost of smart services and customers’ acceptance. However, in accordance to (Kim, Ham, Moon, Chua, & Han, 2019), perceived cost is also an important factor explaining luxury food consumption. In the case of luxury food and restaurants the literature suggests perceived cost has a significant and positive effect on customers’ intention to use when the benefits of using the new technology are realised and luxury food aligned with sustainability ideas by producing high-quality products (De Barnier, Rodina, & Valette-Florence, 2006; Kapferer & Michaut-Denizeau, 2017). By referring to some shred of evidence from existing literature reviews on perceived cost, this study proposes a negative relationship between the smart service cost and customers’ intention to use, which elaborated that the perceived cost of smart restaurant may affect customers’ intention and acceptance to use this kind of services in the future.
Novelty and customers’ acceptance level
The definition of innovation to be perceived as a novel when product or services remark as new, unique, and different to compare with existing services. Thus, novelty considered as a fundamental characteristic of innovation (Rogers, 2002; Rogers, 2010). Yang et al. (2017), argued that an unusual entertaining or new experience only maybe popular for a short period of time. Accordingly, Lian and Yen (2013) illustrated the relationship between novelty and cost. Their finding has shown that innovation may be not acceptable for customers if the price seems too high for them. Mani and Chouk (2017) believed that perceived novelty influences negatively on customer acceptance of smart products. However, prior and recent studied often considered the novelty as a factor that has a positive impact on customer acceptance level (Del Giudice & Pascucci, 2010; Pantano & Di Pietro, 2012; Shankar & Datta, 2018). Hence, According to the Diffusion of Innovation Theory (DOI), the present study proposes the positive and significant relationship between novelty and customers’ acceptance level of smart restaurant services.
Customers’ acceptance level of smart restaurant
The customers’ acceptance is an undeniable key of any technology adoption and implementation. According to Davis, Bagozzi, and Warshaw, (1989) and Pikkarainen, Pikkarainen, Karjaluoto, and Pahnila, (2004) customers do not perceived smart technology as being a one-dimensional feature. It has been noted that customers’ acceptance of smart service has a critical impact on successful smart technology adoption. Mani and Chouk (2017) explained that the smart services and products typically equipped with the technical option which is differentiated restaurant from other existing services, while customers perceived as technological innovation and it may be willing to accept smart services. From restaurant's guests and customers’ perception, the primary purpose is to take meals and dine in to spend couples of their free times. These experiences will be improved in the smart restaurant, whereas the understanding of smart restaurant services has progressed along with the evaluation of technological capability (Mozeik, Beldona, Cobanoglu, & Poorani, 2009). On the other word, while there is an increasing amount of using smart technology, the appropriate technology implement in the restaurant can help to increase business revenue.
This research extended the original TAM, including the suggested motivation and also Diffusion of Innovation. Figure 1 displays the conceptual research models with predicted relationships.
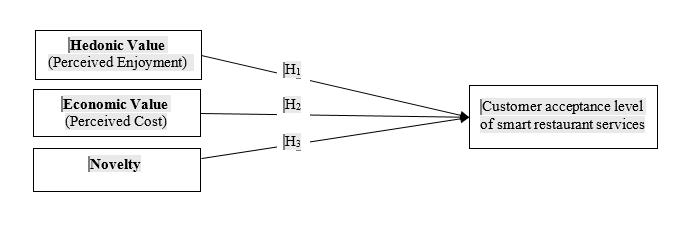
The hypothesis of this research regarding the conceptual framework and based on any significant relationship between each independents variables (IV) and dependent variable (DV) are extracted as follows:
There is a significant and positive relationship between Perceived Enjoyment and Customers’ Acceptance level of smart restaurant service.
There is a significant and negative relationship between Perceived Cost and Customers’ Acceptance level of smart restaurant services.
There is a significant and positive relationship between Novelty and Customers’ Acceptance level of smart restaurant services.
Research Methods
Sampling and Data Collection
This study generated the quantitative techniques, to look for an objective that removes bias, and very narrow and concise focus. In addition, according to Sekaran and Bougie (2016) the data collection method in this study categorises into the quantitative method, which means that the questionnaires carried out to obtain a response from the selected samples in natural environment as non-contrived in real life situation. Furthermore, the sample size of the research conducted based on Roscoe (1975) where the rule of thumb states that the sufficient sample size of 30 to 500. In accordance to Green (1991), the sample size to be obtained for testing of multiple correlation calculated by employing the formula of N ≥ 50 + 8 m (m = 3 refers to 3 independent variables). Hence, the sufficient sample size for this study is 150 valuable responses from the survey for the tabulation of data to prevent any problem during analysis. The sampling method which is applied is Non-probability purposive sampling in particularly judgment sampling is applied in this research. Therefore, the survey administrated to collect data from restaurants customers in Penang, Malaysia.
Measuring Instrument
The questionnaire was designed in two main sections; first section included all demographic questions, which means contains the personal information. The second section includes four different categories of questions regarding the number of variables. To understand about customers’ opinion of perception related with a single latent variable the 5-point Likert scale questionnaire was constructed with ranging from strongly agree to strongly disagree. In order, to achieve the accurate results from this study, it expected that the respondents are more or less familiar with the smartphone, online ordering, and online payment technology. To ensure that the overall measures are proper, reliable and efficient enough to get the final outcome some analysis performed such as factor analysis, and reliability test. The result of the reliability test with 150 respondents indicates that Cronbach’s Alpha coefficients are all in a good and valid range from 0.65 to 0.95 (Table 1).
Data Analysis
The collected data were analysed with descriptive and factor analysis, Multiple Regression Analysis by SPSS statistical software. The customers’ acceptance is moderately strong and positive correlated to perceived enjoyment and novelty with a Pearson correlation coefficient of= +0.708 and +0.512 respectively and significant at 0.000 (p < 0.001), while perceived cost positive and weakly correlated with the customers’ acceptance ( = +0.453). The valid collected sample size (N) is 150 for Multiple Regression Analysis and able to fulfil the assumption.
The proposed Multiple Regression indicates that R value is 0.731 and strong correlation between dependent variable and independents variables. The R Square shows the amount of variance in the Customers’ Acceptance that is accounted for or explained by perceived enjoyment, perceived cost, and novelty. Based on computed R Square, 53.5% of changes in customers’ acceptance can be explained by all these independent variables, and the remaining 46.5% of change to be explained by variation of other factors. The Analysis of Variance (ANOVA) test shows the significant relationship between dependent variable and each of independent variables at p value of 0.000. Therefore, the regression model is significant to explain the research model.
Demographic Profile of Respondents
The demographic collected data indicates that 54.7% of respondents are female and 45.3% are male. However, most of the respondents are in the age group of 20-29 with 55.3%. Besides that, by referring to the demographic profile of respondents in Table 2, the education level of respondents revealed that the majority of them are educated such as bachelor degree with 40.0% and even higher with master and doctorate degree with 38.0% and 12.0% respectively. In the context of monthly household income, the majority of respondents are receiving between RM3001 to RM4500 with 32.0%. These results indicate that two-thirds of the respondents have an acceptable income to afford their food outside in average level food outlets. Furthermore, respondents asked for the frequency of taking meal outside and the amount of ordering above RM30 per month. The results indicate that almost 80% of respondents are regularly taking their food outside more than three times per month. However, 70% of this population has more than three times ordering above RM30 during the month. In overall, the younger respondents with the higher level of education have a better relationship with new devices such as a smartphone, online payment method or smart ordering system, which leads them to feel more comfortable with using of new technology.
Findings
The finding in this study from the empirical research and literature review allows the food and beverage operators, especially restaurant and related industry to get helpful ideas to improve its current services by employing smart services. The business owners who plan to develop their restaurant services with smart technology should aim to provide the easily connected and controllable system. Moreover, for the usability and efficiency of smart and innovative services in the smart restaurant, the user-based approaches in the designing process should be considered as well. Therefore, this research contributes to better success in existing market. In overall, the research model in this research provides an awareness of customers’ acceptance pattern of the popularised and technology-oriented services in any new restaurant context. Therefore, the entrepreneurs and restaurant operators must know how to implement smart technology correctly toward customers’ acceptance of technology (Kimes, 2008).
The results in this study revealed that the perceived enjoyment with P-value of 0.000 is strongly significant. It means that perceived enjoyment as one of the significant factors affects the customer's intention to use and accept the smart restaurant services. This result is consistent with prior studies in the same context such as Igbaria et al., (1994), Yang et al., (2017) and Park et al., (2018). All of the previous researches concluded that hedonic values such as perceived enjoyment has a significant and positive influence on customers’ acceptance of smart technology and services.
The hypothesis evaluation in this study shows the significant relationship between perceived cost and customers’ acceptance with the P-value 0.020 (p < 0.05) while the proposed hypothesis was identified the negative relationship. In this study the computed value of Multiple Regression and Unstandardized Coefficients shows the positive relationship between customers’ acceptance with perceived cost, since, the responses are directly measured the negative relationship through the survey, the evidences indicate that it is a true relationship between perceived cost with customers’ acceptance. The results from the respondents in this study also demonstrate that most of the restaurants’ customers will be satisfied with their new experience even seems expensive to them.
According to Beverungen, Müller, Matzner, Mendling, and vom Brocke, (2017), smart services provide unique features through design, delivery service, and offers that can be distinguished from other resources of the same type. Roy, Balaji, Quazi, and Quaddus, (2018) illustrated that innovation characteristics such as novelty results in customers’ acceptance and resistance towards smart products and services. Hence, from the data analysis results, there is no significant relationship between novelty and customers’ acceptance. It may happen because of some traditional restaurants’ customers who prefer to continue their routines. In accordance with Lian and Yen (2013), and Mani and Chouk (2017) findings illustrated the negative relationship between cost and novelty that influence customers’ acceptance of smart services. In overall, the smart restaurant services did not unique to some respondents while they compare it with the existing ordering system in some restaurant. It means that the respondents do not have any expectation of fully smart services in a dining context.
Conclusion
This study successfully addressed the determinant of customers’ acceptance level of smart restaurant services in Penang, Malaysia. In this research, the extended Technology Acceptance Model (TAM) and Theory of Diffusion of Innovation (DOI) are employed to illustrate which factors influence more and significantly on customers’ decision to use the new technology. The perceived enjoyment is the most significant factor, which plays the key role to increase the customers’ acceptance level of smart restaurant services.
The finding of this study is able to provide significant and meaningful intuition into adopting smart technology in the F&B industry for food and restaurant entrepreneurs. However, several limitations raised during the research procedure that is required to be addressed in future studies. It is essential to consider some factors which can affect customers’ decision-making and sometimes it is not predictable such as psychological barriers or cultural differences. Therefore, future study can utilise the present finding to explore other factors in term of psychological and emotional motivation, which can influence the pattern of customers’ acceptance level of smart restaurant services.
References
Babin, B. J., Darden, W. R., & Griffin, M. (1994). Work and/or fun: measuring hedonic and utilitarian shopping value. Journal of consumer research, 20, 644-656.
Beverungen, D., Müller, O., Matzner, M., Mendling, J., & vom Brocke, J. (2017). Conceptualizing smart service systems. Electronic Markets, 1-12.
Davis, F. D. (1986). A technology acceptance model for empirically testing new end-user information systems: Theory and results. Massachusetts Institute of Technology.
Davis, F. D., Bagozzi, R. P., & Warshaw, P. R. (1989). User acceptance of computer technology: a comparison of two theoretical models. Management science, 35, 982-1003.
Davis, F. D., Bagozzi, R. P., & Warshaw, P. R. (1992). Extrinsic and intrinsic motivation to use computers in the workplace 1. Journal of applied social psychology, 22, 1111-1132.
De Barnier, V., Rodina, I., & Valette-Florence, P. (2006). Which luxury perceptions affect most consumer purchase behavior? A cross-cultural exploratory study in France, the United Kingdom and Russia. Proceedings des Congrés Paris-Venise des Tendences Marketing, Paris. pp. 8-17.
Del Giudice, T., & Pascucci, S. (2010). The role of consumer acceptance in the food innovation process: Young consumer perception of functional foods in Italy. International Journal on Food System Dynamics, 1, 111-122.
Green, S. B. (1991). How many subjects does it take to do a regression analysis. Multivariate behavioral research, 26,499-510.
Hu, P. J., Chau, P. Y., Sheng, O. R. L., & Tam, K. Y. (1999). Examining the technology acceptance model using physician acceptance of telemedicine technology. Journal of management information systems, 16, 91-112.
Igbaria, M., Schiffman, S. J., & Wieckowski, T. J. (1994). The respective roles of perceived usefulness and perceived fun in the acceptance of microcomputer technology. Behaviour & Information Technology, 13, 349-361.
Kapferer, J.-N., & Michaut-Denizeau, A. (2017) Is luxury compatible with sustainability? Luxury consumers’ viewpoint. Advances in Luxury Brand Management. Springer.
Kim, H.-W., Chan, H. C. ,& Gupta, S. (2007). Value-based adoption of mobile internet: an empirical investigation. Decision support systems, 43, 111-126.
Kim, S., Ham, S., Moon, H., Chua, B.-L., & Han, H. (2019). Experience, brand prestige, perceived value (functional, hedonic, social, and financial), and loyalty among GROCERANT customers. International Journal of Hospitality Management, 77,169-177.
Kimes, S. E. (2008). The role of technology in restaurant revenue management. Cornell Hospitality Quarterly, 49, 297-309.
Lai, P. (2017). The literature review of technology adoption models and theories for the novelty technology. JISTEM-Journal of Information Systems and Technology Management, 14, 21-38.
Li, Y.-H., & Huang, J.-W. (2009). Applying theory of perceived risk and technology acceptance model in the online shopping channel. World Academy of Science, Engineering and Technology, 53, 919-925.
Lian, J.-W., & Yen, D. C. (2013). To buy or not to buy experience goods online: Perspective of innovation adoption barriers. Computers in Human Behavior, 29, 665-672.
Lu, J., Yu, C.-S., Liu, C., & Yao, J. E. (2003). Technology acceptance model for wireless Internet. Internet Research, 13, 206-222.
Man, T. W. Y., Lau, T., & Snape, E. (2008). Entrepreneurial competencies and the performance of small and medium enterprises: An investigation through a framework of competitiveness. Journal of Small Business & Entrepreneurship, 21(3), 257-276.
Mani, Z., & Chouk, I. (2017). Drivers of consumers’ resistance to smart products. Journal of Marketing Management, 33, 76-97.
Martins, C., Oliveira, T., & Popovič, A. (2014). Understanding the Internet banking adoption: A unified theory of acceptance and use of technology and perceived risk application. International Journal of Information Management, 34,1-13.
Mozeik, C. K., Beldona, S., Cobanoglu, C., & Poorani, A. (2009). The adoption of restaurant-based e-service. Journal of Foodservice Business Research, 12, 247-265.
Oliveira, T., Thomas, M., Baptista, G., & Campos, F. (2016). Mobile payment: Understanding the determinants of customer adoption and intention to recommend the technology. Computers in Human Behavior, 61, 404-414.
Pantano, E., & Di Pietro, L. (2012). Understanding consumer’s acceptance of technology-based innovations in retailing. Journal of technology management & innovation, 7,1-19.
Park, E., Kim, S., Kim, Y., & Kwon, S. J. (2018). Smart home services as the next mainstream of the ICT industry: determinants of the adoption of smart home services. Universal Access in the Information Society, 17, 175-190.
Pikkarainen, T., Pikkarainen, K., Karjaluoto, H., & Pahnila, S. (2004). Consumer acceptance of online banking: an extension of the technology acceptance model. Internet research, 14, 224-235.
Rind, M., Hyder, M., Saand, A. S., Alzabi, T., Nawaz, H., & Ujan, I. (2017). impact investigation of perceived cost and perceived risk in mobile commerce: Analytical study of Pakistan. IJCSNS, 17. pp. 124.
Rogers, E. M. (2002). Diffusion of preventive innovations. Addictive behaviors, 27, 989-993.
Rogers, E. M. (2010) Diffusion of innovations, Simon and Schuster.
Roscoe, J. T. (1975) Fundamental research statistics for the behavioural sciences [by] John T. Roscoe,
New York.
Roy, S. K., Balaji, M., Quazi, A., & Quaddus, M. (2018). Predictors of customer acceptance of and resistance to smart technologies in the retail sector. Journal of Retailing and Consumer Services, 42, 147-160.
Sekaran, U., & Bougie, R. (2016) Research methods for business: A skill building approach, John Wiley & Sons.
Shankar, A., & Datta, B. (2018). Factors affecting mobile payment adoption intention: An Indian Perspective. Global Business Review, 19, S72-S89.
Susskind, A. M. (2017). The Food-Service Industry: Best of Times, Worst of Times. Cornell University, School of Hospitality.
Venkatesh, V., Thong, J. Y., & Xu, X. (2012). Consumer acceptance and use of information technology: extending the unified theory of acceptance and use of technology. MIS quarterly, 157-178.
Yang, H., Lee, H., & Zo, H. (2017). User acceptance of smart home services: An extension of the theory of planned behavior. Industrial Management & Data Systems, 117, 68-89.
Zeithaml, V. A. (1988). Consumer perceptions of price, quality, and value: a means-end model and synthesis of evidence. The Journal of marketing, 2-22.
Copyright information

This work is licensed under a Creative Commons Attribution-NonCommercial-NoDerivatives 4.0 International License.
About this article
Publication Date
26 December 2017
Article Doi
eBook ISBN
978-1-80296-950-4
Publisher
Future Academy
Volume
2
Print ISBN (optional)
-
Edition Number
1st Edition
Pages
1-882
Subjects
Technology, smart cities, digital construction, industrial revolution 4.0, wellbeing & social resilience, economic resilience, environmental resilience
Cite this article as:
Abhari, S., Jalali*, A., Jaafar, M., & Yean, L. C. (2017). Customers’ Acceptance Level Of Smart Restaurant Services In Penang. In P. A. J. Wahid, P. I. D. A. Aziz Abdul Samad, P. D. S. Sheikh Ahmad, & A. P. D. P. Pujinda (Eds.), Carving The Future Built Environment: Environmental, Economic And Social Resilience, vol 2. European Proceedings of Multidisciplinary Sciences (pp. 490-501). Future Academy. https://doi.org/10.15405/epms.2019.12.48