
Problems of Minimum Salary in Russia

Abstract
This article highlights the issue of low-level minimum wage in Russia which is not in line with the living wage and unable to guarantee an acceptable quality of life. We conducted an investigation of some legal aspects concerning the determination of minimum wage level, its increase, its accordance with the value of consumer basket and minimum assortment. This article’s main goal is to study the theoretical and legal aspects of the determination of a minimum wage in Russia including an investigation of its level dynamics and a minimum wage correlation with a living wage across the state. We used empirical research methods such as ranking, grouping, comparing in our investigation. We also used several statistical research methods (e.g. structural analysis, dynamics analysis, correlation and regression analysis). The statistical research methods helped to determine general factors of the minimum wage changes and their impact on common average income. We developed a correlation-regression model, where «y» is the size of average income per capita and variables «x1» is the size of the minimum wage, «x2» - the nominal size of the average wage, y-per capita income. Y=694,65+0,3213х1+0,7958х2. R=0.99. In the conclusion we state that the minimum wage does not exceed the cost of living, although the Constitution of the Russian Federation guarantees that it should not be less than the latter. Our investigation made it clear that a significant difference between the minimum wage, living wage and the average wage in this country leads to increased property differentiation of the population and a higher level of poverty.
Keywords: Minimum wage, cost of living
Introduction
Today the topic of minimum wages as the guarantor of adequate social standard of living remains hotly debated. In this paper we offer a new approach to identify the problem. The researchers Wong and Ye (2014) found that in China the rise in minimum wage raised life quality, improved working conditions, as well as wages, performance ratio, monthly income level, and hourly wages and provided the reduction of working hours per day (Wong & Ye, 2014).
We investigated the process of establishing the federal minimum wage and its impact on national employment. Public authorities use the minimum wage for improving the living standards of workers with low income. The living wage in some countries gets indexed so that it keeps up with cost of living increases. But some researchers failed to find positive employment effects from minimum wages. The researchers Meer and West (2013) found two opposite employment effects from minimum wage namely, the reduction of demand for new labour force due to an increase of specific marginal costs of staff, and on the other hand, the improvement of relationship between worker and employer in search of new productive forces.
Other authors show that an increase in the minimum wage provides an increase in the intensity of professional retraining of workers (skills improvement) on the part of employers (Reich, Hall, & Jacobs, 2003).
Some other authors treat the effects of increasing the minimum wage on the following points: the impact on the overall employment and unemployment; the process of establishing a minimum level of wages depends on geographic and demographic characteristics, as well as on the territorial jurisdiction of the productive forces; relationships at different stages of the company life cycle. A rise of minimum wage does not entail any direct changes in the labour market, but at the same time there are indirect effects in other sectors (Marginean & Chenic, 2013).
Other researchers studied the mechanism of establishing the minimum wage in a particular local area, its impact on the life of people in these areas. A common adjustment in minimum wages affect larger fraction of workers in the labour market, namely the elderly, women and teenagers. The positive effect of the minimum wage increase provides the reduction of staff turnover and, as a consequence, eliminates the direct costs of the employer to find new workforce, training and so on (Reich, Jacobs, & Bernhardt, 2014).
A group of authors argue that the labour market is more susceptible to the influence of the overall level of expenditure and macroeconomic activity in the area than to the establishment of the minimum wage (Brennan & Stanford, 2014).
Some researchers examined the effects of legal regulation of the minimum wage and the establishment of the standard level of the minimum wage. The key moment in this process, according to the authors, is the fact that the directly established minimum wage does not coincide with the minimum market equilibrium level of wages because of the existing volume of supply and demand of labour. It has a positive effect on teenage employment because teenagers agree to earn a statutory minimum wage which is lower than the market equilibrium price, in exchange for the opportunity to obtain professional experience, knowledge, that is, the formation of human capital (Wilson, 2012).
Today the world is characterised by the economic and financial crises (Bonnet, Saget, & Weber, 2012) so the issues of social protection of the population, support of vulnerable groups of citizens and redistribution of income have become significant. Surveys of labour economists have identified the following areas of investigation concerning minimum wages:
- wages for temporarily unemployed citizens (unemployment benefits);
- retirement benefits;
- health care;
- social security;
- other (minimum wage and social support to migrants, benefits for children, etc.).
Problem Statement
This article investigates the problem of low-level minimum wage in the Russian Federation because this low minimum wage fails to meet the requirements to have a basic quality of life which leaves the family to rely on government programs for additional income
- Nowadays there are lots of social and economic problems, but the problem concerning remuneration for labour, correlation of living wage (LW) with minimum wage amount (MWA) is urgent. Article 37 of the Constitution of the Russian Federation provides the right of every citizen to work and to remuneration for labour without any discrimination (the sum cannot be lower of the minimum compensation for labour established by Federal law) and the right to be protected against unemployment.
- On the one hand, the Labour Code of the Russian Federation states that the minimum remuneration for labour cannot be lower than a living wage and minimum wage should cover compensatory reliefs, incentive payments and social benefits/
- The concept of minimum wage was challenged by employers and organizations of public sector and now it includes some compensatory reliefs (e.g. for arduous, harmful and/or hazardous working conditions, for night shifts, for work performed during weekends or holidays). It should be mentioned that organizations of public sector were the first to apply this challenge. For instance, non-manual staff and auxiliaries in schools and nursery schools must perform additional work for a minimum wage (e.g. a watchman must work as a stocker). Changes in the labor law indicate that they reflect the interests of employers and worsened the life of working people.
Research Questions
The study of legal aspects of minimum wages
Analysis of the dynamics of size and the ratio of cost of living
The theoretical part of our investigation was devoted to the study of legal aspects of the minimum wages in Russia, analysis of the dynamics of its size, the ratio of cost of living throughout the country and its regions, and the development of recommendations for improving the methodology for the minimum wage calculation in order to ensure social security of working citizens.
Analyses of the consumer basket, fixed minimum set of products
The theoretical part considers the problem of the increase of the minimum wage and its compliance with the cost of the consumer basket, as well as a fixed minimum set of products. The analytical part deals with the analysis of the minimum wage, its dynamics and its ratio with the cost of living, the income per capita throughout the country and in its federal districts.
Analysis of data by regions on the population with incomes below the poverty level
The report presents the analysis of data by regions on the population with incomes below the poverty level throughout Russia and its territorial entities/
Purpose of the Study
This article’s main goal is to study the theoretical and legal aspects of the determination of minimum wage in Russia, to investigate its dynamics, the correlation of minimum wage with living wage in the state in general and within federal districts in particular; a development of recommendations for the improvement of methodology of minimum wage calculations to guarantee social security of working people.
Research Methods
We used theoretical and empirical research methods in this study.
Theoretical research methods
We used different theoretical research methods such as dialectical approach, deduction, analyses, synthesis. These methods helped to determinate the main characteristic features of the minimum wage.
Empirical research methods
Such empirical research methods as ranking, grouping, comparing were used in this paper. These methods helped to compare the data among different Russian federal districts and also among different countries.
At the same time, we used several statistical research methods (e.g. structural analysis, dynamics analysis, and correlation and regression analysis). On the basis of the statistical research methods, we learnt common factors of changes in minimum wage and their impact on general average income of people.
The theoretical part of the research was devoted to the study of legal aspects of the determination of minimum wage, its increase, its correlation with the value of consumer basket and minimum and fixed assortment. The analytical part of the research deals with minimum wage, its dynamics and proportion with the living wage and with an average income across the state in general and within its federal districts in particular.
It is generally known that minimum wage performs a social function, protects a working person against his illegal exploitation by employers and prompts a discharge of social guarantees to working people. But we believe that the system of minimum wage does not perform its social and protective functions in the Russian Federation.
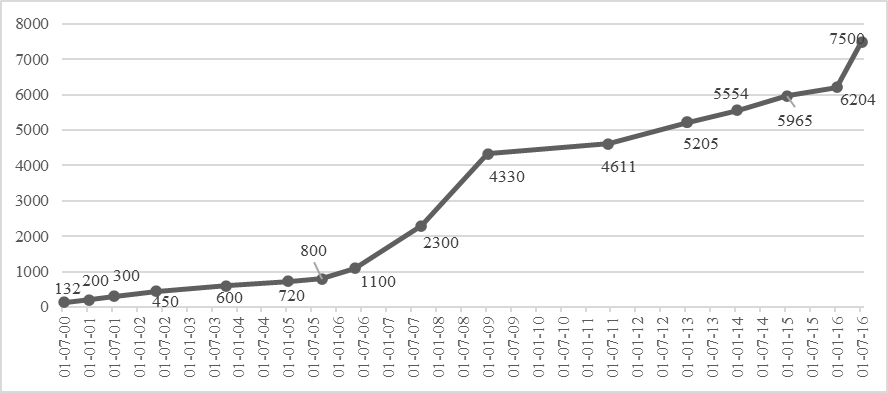
In Russia minimum wage was raised on the 1st of July 2016 up to 7,500 roubles.
Fig.1 reports on the dynamics of minimum wage in Russia.
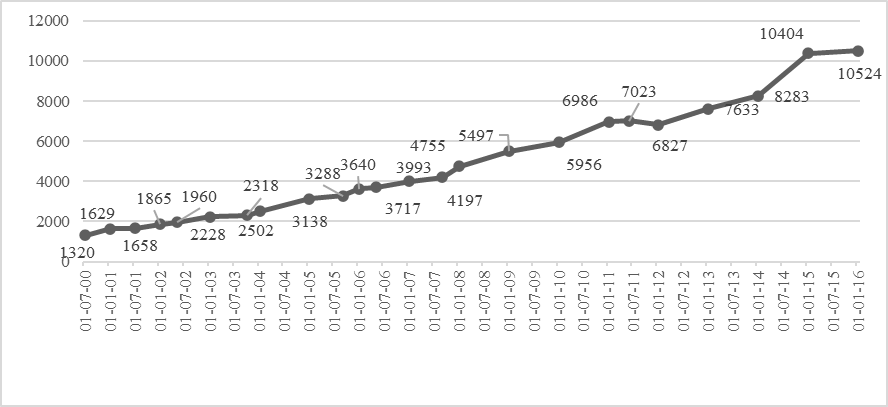
The figures show the increase of minimum wage, but we should compare dynamics of growth of living wage of working people and their correlation. Fig.2 reports the dynamics of growth of living wage in the years 2000 - 2016. Positive dynamics of established living wage does not give any objective information. Fig. 3 displays a correlation of minimum wage level to living wage level and gives more information.
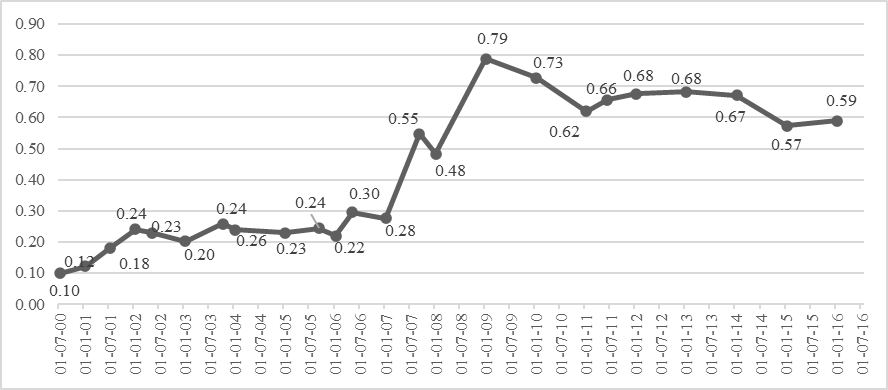
In 2000 there was the lowest correlation of minimum wage level to living wage level and equals only 0.1, i.e. the minimum wage covered only 10% of living wage for a working person. For the years 2001 - September 2007 this correlation was not above 0.3, but later it grew quickly to 0.55. The highest correlation was seen in 2009 and index was 1.1. – 0.79, later it decreased to 0.68–0.66 and was not changed up to 2014. In 2015 this index was 0.57, and on January 1, 2016 it equalled to 0.59. Apparently, in comparison with the data in the beginning of 2000-s indexes grew up, but normal level of indexes established by law had not been reached during last 16 years.
If we analyse the changes in the living wage we will see that its calculation in the second part of the year 2015 is contradictory, taking into account the information of price indexes in 2015.
According to Fig. 1 price indexes were growing up except indexes on food products in summer. In fact, according to the Federal State Statistics Service the inflation rate was 12.91% in 2015. It is unclear why the living wage at the end of 2015 equalled to 9,452 roubles if annual inflation rate was 12.91% (it was the highest inflation rate for last 8 years and the inflation rate was higher only in 2008).
January 1, 2013 was the beginning of changes in calculating the market basket which is the basis for calculating living wage. The comparison of the market basket contents does not allow making any strong conclusion. On the one hand, the market basket indicates that norms of intake of meat, milk and fruits grew up. On the other hand, a correlation of values of non-food products was established, which is 50% of food products values independently of the population category. The same correlation was established for consumer services. The government determined intake norms of some types of goods and services up to 2013 and we believe that this intake expressed in terms of money is higher than 50% of the products value.
We dealt with the concept of the minimum and fixed assortment of consumer goods. The Resolution of the government of the Russian Federation №54 from January 28, 2013 established the methodical recommendation to determinate the consumer basket for the main social and demographical groups of population in federal districts of the Russian Federation.
The minimum set of food for the main socio-demographic groups was formed taking into account the distribution of the Russian Federation into the zones which were formed depending on the following factors: climatic and economic conditions; peculiarities of the food production; national traditions and local peculiarities in the nutrition of the population; prevailing diet based on the actual food consumption in low-income families; the need to meet the nutrients requirements; higher energy value of food for people living in the North.
Due to the fact that territorial entities of the Russian Federation have a significant differentiation in their socio-economic development, the definition of the financial assistance sizes provided by the Federal Centre is one of the most important aspects of the budget process. The cost of a fixed basket of consumer goods and services is determined by the purchasing power of individual entities of the Russian Federation. This indicator can be used as an auxiliary tool in the inter-regional comparisons of purchasing power.
The structure of a fixed set for inter-regional comparisons included 30 food products, 42 non-food items and 12 paid services.
Let us compare the cost of a fixed and a minimum set of consumer goods. Table 2 shows the value set in January of each year and gives a fixed set excess over the minimum. Accordingly, in the period from 2002 to 2016 fixed set value increased 4.8 times, and the cost of the minimum set increased 3.9 times. Moreover, a trend of increasing excess of a fixed set over minimum from 3.0 to 3.8 times has been noticed, which indicates a high level of differentiation of the goods value within the country. It is also worth noting that the size of the minimum wages is below the poverty level.
The table indicates that the minimum wage increased regularly over the years, but the interpretation of the concept of a minimum wage has also changed, but so far it has not reached the minimum poverty level of the working population.
The size of living wage during the past 15 years has increased 8 times. However, if we consider the effect of inflation, the living wage should be compared based on the analysed period, the consumer price index. Table 3 analyses the dynamics of poverty level (PL). It is seen that the cumulative PL growth rate at current prices amounted to 15 800.7%. The highest growth rate of the PL as for the previous year was observed in 2015, 2002, 2008. The consumer price index was the highest in 2001 - 118.5% 2002 115% -, 2015- 112.9%. Table 1 shows the calculation of the PL size in prices of the year 2000. So, if in 2000 the PL equalled 1210 roubles, in 2015 it equalled 2070.4 roubles in prices of the year 2000. In 2015 PL in prices of the year 2000 prices increased in comparison with 2000 by 71.1%, while the inflation factor based on the consumer price index during 15 years amounted to 4.69 times. Hence it is clear that the depreciation of the poverty level was more than 2.7 times. If we take the living wage amount in 2000 as the baseline, then use the CPI as the recommended rate of growth, in 2015 the living wage size would have amounted to 45455.1 roubles. Given what the size of the poverty in 2015 was 9701 rubles, then our results indexing by the consumer price index in 2000 PL is high enough. This may be due to the comparison base of the year of 2000, while the calculation of the consumer basket was different.
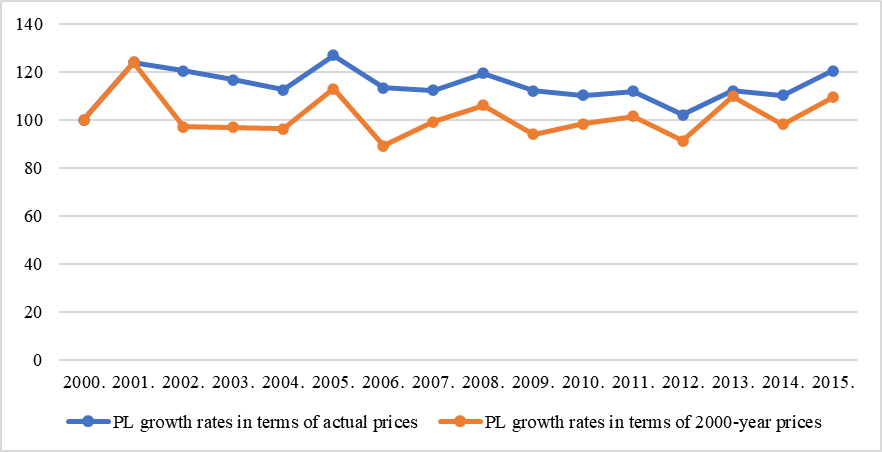
Figure 4 shows the growth rates of the poverty level at 2000 prices and current prices. It is evident that in nominal terms, the size of a living wage grew faster than in reality.
Findings
Let us consider the impact of the minimum monthly wage on the size of the average income per capita. We will see that the minimum monthly wage has a reproductive function, i.e. the role of the minimum wage in the formation of average income per capita. The second factor will be the nominal average wage in the country as a whole.
While carrying out the statistical analysis we will develop a correlation-regression model, where y is the size of average income per capita, as well as variables x1 is the size of the minimum wage, x2 - the nominal size of the average wage.
Table 4 presents the results of a statistical regression analysis of income per capita, depending on the size of the minimum wage and nominal wage.
As a result of calculations we can draw up the equation:
Y=694,65+0,3213х1+0,7958х2(1)
The influence of positive factors is observed. However, it is clear that the impact of the minimum wage on the size of the average income per capita sizes is rather low - 0.3213, while the effect of the nominal wage is high enough - 0.7958. Hence the size of the average income per capita is not strongly dependent on the size of the minimum wage, probably because of its low size.
Let us check the results. The determination coefficient - R2 equal to 0.99, which is very high, indicating the statistical significance of the studied factors.
Residual autocorrelation check using Durbin Watson criteria:
The result we obtained is equal to 1.3923. Let’s compare it with tabular data when n = 2, m = 16, where the upper value is 1.37, the lower value - 1.10. Our result is above the upper value, but less than 2, which indicates that there are no autocorrelation residues. We have also carried out autocorrelation analysis using Brescia-Godfrey test, where the observed value is less than the critical value, which means that there is no autocorrelation.
Besides, we have carried out the data heteroscedasticity analysis using White's test. As a result of the analysis were obtained statistically significant determination coefficient - 0.72.
The compilation of statistics observed χ_obs ^ 2 = nR ^ 2. This value is compared with the tabulated value of chi-square distribution at the level of significance α if the number of degrees of freedom (m-1), m- the number of parameters in the last regression. Then we checked 16 * 0.7184 = 11.49, which was less than the tabulated value 24.99. This indicates the absence of heteroscedasticity.
Thus, these calculations have shown that the resulting regression model is statistically significant. Analysis of the model suggests a role of the low minimum wages in the formation of the average income per capita of the Russian citizens.
Let us analyse the data of Russian Statistical Service on the number of people with incomes below the subsistence minimum in Russia and its territorial entities. We have determined the regions with the highest and lowest proportion of the population with incomes below the subsistence minimum for each federal district for the years 2009-2015.
As for the Central Federal District, the most favourable conditions had the Belgorod region, where recent years have seen the smallest proportion of population, suffering from extremely difficult financial situation. In contrast, the situation in Ivanovo and Smolensk regions is the worst in the Federal District for the analysed period. As for the North-western Federal District in the years 2009-2013, it had the least number of poor people recorded in the Nenets Autonomous Okrug. In the years 2014-2015 St. Petersburg had the least number of poor people while the largest number of poor people lived in the Vologda and Pskov regions. The Republic of Kalmykia with remarkable consistency is a leader in the share of poor people in the Southern Federal District for the entire period, while the Krasnodar region has the district’s minimum proportion of poor people. As for the North Caucasus Federal District, the lowest proportion of poor people was found in the Republic of Dagestan, and the largest proportion of poor people have the Republic of Ingushetia and the Karachay-Cherkess Republic.
Let us consider the workers’ gross wages distribution by type of economic activity in 2015. The records of the Russian Statistical Service “Labor and Employment in Russia, 2015” analysed data regarding core activities. Analysis of the data in the whole of Russia showed that 10.4% of workers are paid at a rate of 25,000-30,000 roubles per month, 9.4% is paid - 50000-75000 roubles, 8.8% get - 40000-50000 roubles, 8.3% get 18600- 21800 roubles, 8.2% get 30000-35000 roubles, 8.0% get 21800-25000 roubles. The salary of more than 100,000 roubles is received by 3.2% of the population and less than 9000 roubles is paid to 7.9% of workers.
In terms of sectors, the situation is different depending on the type of activity. In agriculture, 9.9% of workers get a salary of 18600-21800 roubles per month. Unlike other sectors, the salary 9000 roubles was paid to 16.9% of agriculture workers, and more than 100,000 roubles was paid to only 0.4%, which is 8 times lower than the industry-wide index. The mining industry is notable for the fact that most workers received high enough wages compared with the other industries. Thus, 21.6% of employees received 50000-75000 roubles, 10.9% got 75000-100000 roubles, more than 100,000 roubles got 11.3% of employees, which is 3.5 times higher than industry-wide value. In the sector of "manufacturing industries' the average income is lower than in the previous sector, but higher than the industry-wide values. 13.4% of workers get wages of $ 25,000-30,000 roubles, 10.7% get 30000-35000roubles, 8.0% get 35000-40000 roubles, 10.1% get 40000-50000 roubles. In the sector of "electricity, gas and water production and distribution» most of the workers were paid 25-30 thousand roubles, 10% of employees get 18,6-21,8 thousand roubles, 9.9%get 50-75 thousand roubles. Most of the construction men receive a high salary of 50-75 thousand roubles - 12.3% of workers, 40-50 thousand roubles were paid to 11.2%, 25-30 thousand rub. were paid to11.3%, also the proportion of 75-100 thousand roubles wage earners is 4.6%, more than 100 thousand roubles - 3.7%. The retail workforce, the largest group of workers, receive a salary of 25-30 thousand roubles, in general, the employees who receive salary in the amount of 18.6 to 35 thousand constitute only -37.3%. In the area of "hotels and restaurants”, workers receiving from 18.6 to 35 thousand roubles compose only 34.6%. The "transport and communication" workers were paid higher because 12.4% of employees received- 50-75 thousand roubles. In the area of "financial activities" the wages are also high, more than 100 thousand roubles is paid to10.7% of workers, 50-75 thousand rub. Is paid to 15.7% and 40-50 thousand roubles are paid to 12.7%. It should be mentioned that in the area of "research and development", in contrast to the sphere of "education", most of the employees (18.3%) were paid 50-75 thousand roubles, 40-50 thousand roubles were paid to 13.7% of the employees. The "education" sector is marked by the highest proportion of workers receiving the lowest salaries: salary up to 5965 roubles is paid to 3.4% of the employees, 5965 - 7400 roubles is paid to 7.5%, 7400 – 9000 roubles is paid to 6, 4%. The number of employees who received 25-30 thousand roubles amounted to 9.6%, 21,8-25 thousand rub.- 8%, 18,6-21,8 -8.6%. The "health care" sector reveals the same situation with the average salaries as the education sector, but the proportion of workers receiving the lowest salaries is still lower than in the education sector, but higher than the industry average (9.5% with a salary of up to 9,000 roubles).
Analysis of statistical data on poor households has led to the following conclusions: the majority of poor households live in cities with population of fewer than 50 thousand people; by composition these households consist of 4 people; by the number of children - families with one child up to 16 years. Interestingly, families with more children as a percentage have a lower proportion
Conclusion
Our investigation leads to the conclusion that the minimum wage does not meet the required level of remuneration, which allows meeting the priority needs. Firstly, the nature of minimum wage should comply with reproductive function that is creating the conditions for the employee to restore their capability to work. However, it should be sufficient for normal reproduction capability for workers performing ordinary (unqualified) work under normal working conditions.
The minimum wage is not indexed in line with the growth of consumer prices; hence, its size is depreciated each year. Any social and regulatory role of the minimum wage is reduced to zero. The minimum wage does not exceed the cost of living, although under the Constitution it should not be less than the latter. The value of the subsistence minimum is also growing more slowly compared to inflation rates. When modelling a situation where the living wage is indexed to the rate of inflation, its value would be now several times higher. Analysis of the impact of the minimum wage and the size of the nominal size of the salary to the average per capita income showed a greater effect of nominal wages growth by the income amount per capita. Analysis of the proportion of the population with incomes below the poverty level has shown that generally the same regions appear to be the poorest in their federal districts.
It seems that the legislation of the Russian Federation provides challenges for employers to ignore the needs of their employees. We see that only a small proportion of regions set the regional minimum above the federal values. It can be explained by the lack of budget funds needed to increase the minimum wage. It is clear that the Constitution’s guarantees are essentially formal and have no valid social function.
Another controversy is the issue of the family burden on minimum wage, as well as the methods for determining the minimum wage. The issues of determining the minimum wage’s correlation with a living wage and for which working group it is calculated for are hotly debated. In addition, some economists believe that nowadays the subsistence minimum for working population, paid by the employees at their own expense and primarily due to payroll, do not take into account cultural, educational and health care needs of the employees. A significant difference between the minimum wage, living wage and the average wage in the country leads to increased property differentiation of the population and the increased level of poverty, which may cause disruption of social peace and social harmony, and also threaten economic and social security of the country.
Thus it is necessary to improve the legislation in terms of determining the minimum wage as well as to improve the methodology for its calculation in order to implement the constitutional guarantees and rights of citizens.
Acknowledgments
This article was written with the support of the Russian Foundation for Basic Research (RFBR) under the grant number 16-06-00327 “Improving the minimum wage determination methodology in order to implement the social security of working people"
References
Bonnet, F., Saget, C., & Weber, A. (2012). Social protection and minimum wages responses to the 2008 financial and economic crisis: findings from the International Labour Office (ILO) /World Bank (WB) Inventory. Retrieved from https://www.ilo.org/global/lang--en/index.htm
Brennan, J., & Stanford, J. (2014). Dispelling minimum wage mythology. The Minimum Wage and the Impact on Jobs in Canada, 1983-2012. Canadian Centre for Policy Alternatives. Retrieved from https://www.policyalternatives.ca/
Marginean, S., & Chenic, A. S. (2013). Effects of Raising minimum wage: Theory, Evidence and Future Challenges. Procedia Economics and Finance, 6, 96-102.
Meer, J. (2013). Jeremy West. Effects of the Minimum Wage on Employment Dynamics, 50. Retrieved from http://economics.cornell.edu
Reich, M., Hall, P., & Jacobs, K. (2003). Living wages and Economic Performance. The San Francisco Airport Model, 81. Retrieved from http://www.irle.berkeley.edu
Reich, M., Jacobs, K., & Bernhardt, A. (2014). Local Minimum Wage Laws: Impacts on Workers, Families and Business. Institute for research on labor and employment. Report prepared for the Seattle Income Inequality Advisory Committee. 44. Retrieved from http://irle.berkeley.edu.
Wilson, M. (2012). The Negative Effects of minimum Wage Laws. Policy Analysis. CATO Institute. (701). Available at SSRN: https://ssrn.com/abstract=2226952
Wong, H., & Ye, S. (2014). Impact of Enforcing a Statutory Minimum Wage On Work And Quality Of Life Of Vulnerable Groups In Hong Kong. International Journal of Social Welfare, 223-235. DOI:
Copyright information

This work is licensed under a Creative Commons Attribution-NonCommercial-NoDerivatives 4.0 International License.
About this article
Publication Date
27 June 2017
Article Doi
eBook ISBN
978-1-80296-948-1
Publisher
Future Academy
Volume
1
Print ISBN (optional)
-
Edition Number
1st Edition
Pages
1-161
Subjects
Business, management, behavioural management, macroeconomics, behavioural science, behavioural sales, behavioural marketing
Cite this article as:
Tsertseil, J. S., & Kookueva*, V. V. (2017). Problems of Minimum Salary in Russia. In Z. Bekirogullari, M. Y. Minas, & R. X. Thambusamy (Eds.), Business & Economics - BE-ci 2017, vol 1. European Proceedings of Multidisciplinary Sciences (pp. 66-79). Future Academy. https://doi.org/10.15405/epms.2017.06.8