
Change Specifically Responses To Mtor Inhibition Based On Brain Of N. Guentheri


Abstract
Torin 2 is a new powerful ATP-competitive inhibitor of two mechanistic target of rapamycin (mTOR) complexes, which are central regulator of growth, proliferation and viability in the cell. This chemical agent was specifically developed and can be verified as potential drug to combat a number of age-related diseases, including cancer, neurodegenerative diseases, cardiomyopathy, sarcopenia, as a more promising alternative to such a well-known substance as rapamycin. Compared to rapamycin and its analogues, Torin 2 has increased bioavailability and an improved pharmacokinetic profile. To improve understanding of the effect of Torin 2 on cellular signaling pathways (including mTOR) and other biological processes, the gene expression changes were estimated in the brain tissues of the annual African killifish Nothobranchius guentheri after prolonged oral administration of Torin 2. Based on the mRNA-seq data, an overrepresentation analysis was performed, including FSEA (Fold-Change-Specific Enrichment Analysis; according to the Gene Ontology database), which, unlike the classical GSEA, narrows down the groups of analysed genes to those that have similar expression changes between the compared groups. Also, in this study, we conducted weighted gene co-expression network analysis (WGCNA) and identified several modules of co-expressed genes, many of which are enriched with participants of key biological processes. Several modules demonstrated predominant differential expression between Torin 2 group and control samples. Our findings may provide a better understanding of the processes partially regulated by mTOR as well as sensitive to Torin 2 inhibition.
Keywords: FSEA, mTOR, RNA-seq, transcriptome, Torin 2, WGCNA
Introduction
The mechanistic target of rapamycin (mTOR) is a highly conserved serine-threonine protein kinase. MTOR is sensitive to external signals and as a part of two multi-protein complexes (mTORC1 and mTORC2) participates in regulation of growth and vital cell activity. The mTORC1 and mTORC2 complexes share common subunits and structural similarities, but are functionally different. Thus, mTORC1, which is sensitive to nutrients, is a superior regulator of the pathways responsible for translation, growth, proliferation, survival, and autophagy (Eskelinen, 2005; Harwood et al., 2018; Ma & Blenis, 2009; Saxton & Sabatini, 2017). mTORC2, which responds to growth factors and hormones, is involved in transcription regulation, telomere length control, lipogenesis, actin cytoskeleton organization, and glucose transport. mTOR also plays a special role in the normal development process, particularly in the development of the central nervous system, including the elongation and branching of neurites, the formation of dendritic spines, synaptic consolidation and plasticity, memory storage and cognition (Ehninger et al., 2008; Giorgi et al., 2015; Scheffer et al., 2014). Impaired mTOR signaling pathway is associated with the onset and progression of a number of neurological and neurodegenerative disorders, including hemimegalencephaly, focal cortical dysplasia, Kretzel syndrome, and focal epilepsy (Sato, 2016) Several mutations in the genes involved in mTOR signaling, such as TSC1, TSC2, LYK5/STRADA, AKT3, and DEPDC5, have been shown to enhance mTOR signal transduction and lead to brain damage and neurodevelopmental disorders. It is noteworthy that mTOR inhibition has a positive effect on the treatment of certain brain pathologies including epilepsy, autism and learning disabilities (Kilincaslan et al., 2017; Koenig et al., 2008).
In the previous work, we studied the effect of a new promising mTOR inhibitor on the brain gene expression profile of N. guentheri (seasoned African killifish) (Guvatova et al., 2021). Torin 2 is a dual ATP-competitive inhibitor of both mTORC1 and mTORC2 complexes, which, compared to known mTOR inhibitors (rapamycin and rapalogs), has improved pharmacokinetics and bioavailability. Detailed study of the brain transcriptomic changes under the influence of Torin 2, was performed. Taking together commonly used computational instruments including differential gene expression analysis and gene set enrichment analysis (GSEA), we found significant changes in some signaling and metabolic pathways associated with translation, RNA metabolic processes, DNA binding, macromolecular and protein metabolism, as well as regulation of dendritic spine maintenance.
However, the mRNA-Seq data contains much more information than is usually extracted using classical methods. In present study we reanalyzed the data obtained earlier. The Fold-Change-Specific Enrichment Analysis (FSEA), a new method of functional annotation of differentially expressed genes, was chosen. The FSEA identifies functionally related groups of genes according to hypothesis that expression with a certain magnitude for that groups probably correlates with similar functional issues (Grabherr et al., 2011). Finally, we performed specific type of gene co-expression analysis, WGCNA (weighted gene correlation network analysis). It is helpful tool to reveal clusters of co-expressed genes suggested to be involved in the same cellular processes, as well as potential Torin 2 responders.
Problem Statement
The classical algorithm for functional gene enrichment, such as Gene Set Enrichment Analysis (GSEA, used for functional annotation of differentially expressed genes in the brain transcriptome of N. guentheri do not fully reflect the functional relationships of biological processes that are important for predicting the therapeutic effects of Torin 2.
Purpose of the Study
We aimed to identify functionally associated biological processes missed in previous study with less sensitive common methods, for brain tissues isolated from Torin 2 administrated N. guentheri killifish.
Research Methods
Males and females N. guentheri at the age of 6 months were transferred to an experimental diet with the second-generation mTOR pan-inhibitor Torin 2 at a dosage of 30 mg/kg of body weight per day. At the age of 10 months, control and experimental individuals were euthanized and then dissected. From the obtained brain samples, 21 cDNA libraries were prepared and then sequenced on the NextSeq 500 System (Illumina, USA). The sequencing data is available at the NCBI sequence Reading archive (BioProject ID PRJNA661435).
A detailed description of the killifish housing and diet, the cDNA libraries preparation, and the RNA-Seq data analysis are presented in the previous work (Guvatova et al., 2021). In this article, we reanalyzed these data the FSEA and WGCNA. Briefly, using the joint pool of derived trimmed reads (approximately 25 million reads per sample), the transcriptome assembly was performed using Trinity 2.9.0 (Grabherr et al., 2011). The annotation was made up using Trinotate 3.2.1. Then, the derived Illumina reads were mapped to the assembled transcripts using bowtie2 and quantified with RSEM. Read counts per gene were analyzed with edgeR using relying on the quasi-likelihood F-test (Robinson et al., 2009). For FSEA, differentially expressed genes (DEGs) were split into several bins according to the binary logarithms of fold changes (LogFC; bin size was chosen as 0.25). LogFC range -4…+4 was scanned with a sliding window containing one, two or four bins (i.e. LogFC range 0.25, 0.5, 1.0). For each window, gene set enrichment analysis was performed using topGO package (Gene Ontology). Then, the results were summarized across all the windows.
WGCNA was carried out using WGCNA package R. Two of twenty-one samples were removed as outliers. To reduce the impact of possible other outliers, biweight midcorrelation approach was used instead of Pearson correlations used by default. To eliminate the predominant impact of sex-specific gene expression differences, female and male samples were analyzed separately. For each derived module (a cluster of co-expressed genes), gene set enrichment analysis (Gene Ontology) was performed.
Findings
According to the WGCNA results, a total of 121 and 178 modules of co-expressed genes were identified, for males and females, respectively. 8 and 7 of them contained at least one thousand genes. Almost all modules of large modules were highly enriched with genes involved in various biological processes. The significant part of GO terms overrepresented in various WGCNA modules were also detected with classical GSEA and FSEA analyses (Torin 2 versus control). Similarly, the vast majority of biological processes identified from GSEA/FSEA, were noticed as overrepresented GO terms for various WGCNA modules. This suggests that Torin 2, along with the biological cross-sample variability, has a significant impact on gene expression profiles in a way that is reflected in the co-expression analysis results. For several modules (1-4, 11, 18 – females; 2, 5, 7, 16 – males;see the Figure 1) we found differential expression (between the Torin 2 treated and control groups) for a significant part of genes included in these modules.
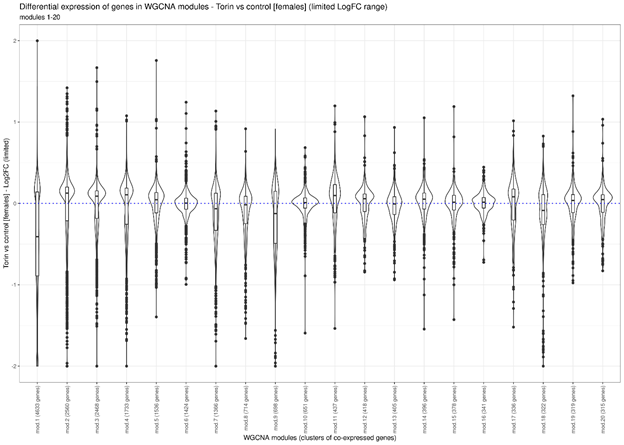
Violin plots show distribution density of LogFCs values (Torin2 versus control) for each gene in a module. Boxes inside violin plots indicate inter-quartile range (IQR). All data points that are further than 1.5*IQR from the box are marked as outliers (solid circlesThe largest co-expression module 1 (includes 8677 genes) is highly enriched with genes participating several disjointed biological processes with minimal gene overlaps: intracellular transport, cellular localization, mRNA processing, proton transmembrane transport, proteolysis involved in cellular protein catabolic process, ATP synthesis coupled proton transport. We have noted the same trend for many other modules. Thus, we see that: 1) the genes involved in these disjointed biological processes change their expression consistently between the samples, and 2) these biological processes are enriched with differentially expressed (DE) genes according to the GSEA/FSEA results when comparing Torin-treated and control groups. Therefore, this allows us to assume the coordinated regulation of these biological processes in response to exposure to Torin 2.
From the data obtained after FSEA, we selected GO terms enriched with DE genes with certain fold-change values (FDR < 0.05), which we believe may be functionally related. There is little data in the literature about Fold-change-specific GO terms, because usually the functional enrichment analysis of the gene set does not take into account the strength of changes in the expression level of a gene. Fold-change-specific GO terms are described only in a few works, including studies of the plant transcriptome ofand (Omelyanchuk et al., 2017; Sharma et al., 2019) and the cell transcriptome of(Laurent et al., 2013).
The results of the FSEA oftranscriptome imply the role of Torin 2 in the down-regulation of processes related to circadian rhythms in the male group, while no such changes were observed in females. We found a statistically significant enrichment of "circadian temperature homeostasis", "circadian regulation of translation" GO terms for sets of genes with pronounced changes in expression level (-2.5 < LogFC < 2). For the "circadian regulation of gene expression" GO term, we noticed enrichment with genes with a smaller magnitude in expression (-2.5< LogFC<0.5). Circadian rhythms are known to regulate the expression of several hundred transcripts that are largely involved in metabolism (Laurent et al., 2013). Our data are consistent with studies in mammalian models showed that males and females exhibit differences in many metabolic processes and gender characteristics are typical for brain morphology, immune and cardiovascular systems (Ruigrok et al., 2014; Takahashi, 2017).
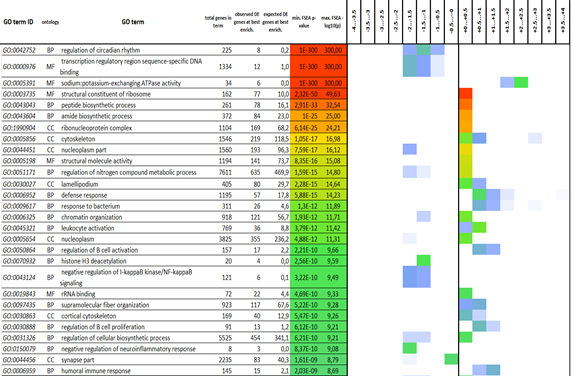
DEGs were split into several bins (bin size 0.25) according to the binary logarithms of fold changes (LogFC). LogFC range from -4…+4 was scanned with a sliding window containing two bins (i.e. LogFC range 0.5). For each window, classical gene set enrichment analysis (GSEA) was performed (Gene Ontology database), and finally for each bin we choose the best GSEA p-value from the overlapping windows. The derived p-values were log-transformed into scores: score = -log10(p). The heatmap demonstrate the derived scores, from weak (blue) to strong (green, yellow, red) statistical significance. – minimal enrichment p-value among the sliding windows.
It is known that the known mTOR signaling inhibitors rapamycin and rapalogs demonstrate immunosuppressive properties (Hayward et al., 2001). In contrast, our results of transcriptome analysis of males treated with the second-generation mTOR inhibitor Torin 2 showed a significant increase in the expression of genes associated with the immune response. GO term "immune response" was enriched with genes with a change in expression in the LogFC range from 0 to +2.5 (Figure 2). On a closer look, we noticed many immune system-related processes such as positive regulation of lymphocyte activation, lymphocyte migration, lymphocyte chemotaxis, etc., that are significantly enriched with slightly upregulated (+0.5 < LogFC < +1.0). At the same time, enrichment analysis of the genes with more pronounced changes (+1.5 < LogFC < +2.0) revealed the overrepresentation of genes involved in chemokine activity, chemokine receptor binding, including the CXCR3, CXCR5, and CCR10 receptors. It is known that T-lymphocytes can enter the central nervous system (CNS) directly into the cerebrospinal fluid through the vascular plexus. The transport of T-lymphocytes to the central nervous system through the vascular plexus can be enhanced in various neuroinflammatory and neuroinfectious diseases characterized by increased levels of chemokines in the cerebrospinal fluid (Dabrowska et al., 2021; De Boeck et al., 2020; Yoo et al., 2019). It is possibly that the Torin 2 diet triggered the immune response in the fish, which we observed at the patterns of brain gene expression in males.
Another example: GO term "potassium-transporting ATPase activity" is detected by FSEA in males (+1.5 < LogFC < +2.5), but it was not identified in the previous work. ATPase activates the membranes of synaptic vesicles, allowing transporters to load the vesicles with neurotransmitters. The regulated release of neurotransmitters from the synaptic vesicles into the synaptic cleft allows the signal to propagate from the axon end of the presynaptic neuron to the dendrite of the postsynaptic neuron (Forgac, 2007).
In the same range of LogFC values (+1.5 < LogFC < +2.5) we observed overrepresentation of genes responsible for the actin cytoskeleton organization. The activity of ATPases is regulated by several specific effectors, in particular, acetylated tubulin, which interacts with ATPases and inhibits their enzymatic activity. This acetylated tubulin is part of the microtubules (Arce et al., 2008). Myosin motors drive such diverse cellular functions as cytokinesis, membrane transport, organelle movements, and cell migration (for each of these processes, we observed a related change in the expression of the genes encoding the components of these processes). The reversible interaction of acetylated tubulin with sodium, proton, and calcium pumps regulates their catalytic activity (Hwang et al., 2017).
During B-cell activation, the actin cytoskeleton undergoes a reorganization that is important for changes in BCR (B-cell receptors) motility, B-cell morphology, and molecular interaction, and thus affects the formation of BCR microclusters and immune synapses, which are important for BCR signaling and antigen accumulation (Li et al., 2019). The actin cytoskeleton is involved in the regulation of the BCR signaling threshold for antigenic stimulation, the kinetics and enhancement of BCR signaling activity, and the timing and kinetics of signal suppression. Actin performs its regulatory function by controlling the kinetics, magnitude, subcellular location, and nature of BCR clustering and the formation of the BCR signaling complex at each stage of signal transmission (Ojeda et al., 2011).
The predominant overrepresentation of genes participating PI3K-associated signaling pathways (phosphatidylinositol 3-kinase complex, class III, phosphatidylinositol-3,4-bisphosphate 4-phosphatase activity) was observed among DEGs with negative LogFC in females (-3.5 < LogFC < -3.0). It is known that the direct inhibition of PI3K in brain neurons leads to the formation of a population of cells that differentiate into motor neurons. Suppressing PI3K and enhancing GSK3ß and HB9 signaling in the brain is a potential way to generate these cells (St. Laurent et al., 2013). In addition, the reduced activity of this pathway is of a special interest in the context of the negative feedback loop of the PI3K-AKT-mTOR pathway and requires more detailed study.
Conclusion
FSEA and WGCNA analyses revealed that groups of genes with coordinated response are a valuable source of information and allow us to identify functional relationships between different biological processes. In this study we demonstrated the potential relationship between the cytoskeleton organization, activation/penetration of B-lymphocytes and the ATPase activity in the brain of N. guentheri in response to Torin 2 administration.
Acknowledgments
This work was supported by the Ministry of Science and Higher Education of the Russian Federation, grant no. 075-15-2019-1660.
References
Arce, C. A., Casale, H. C., & Barra, H. S. (2008). Submembraneous Microtubule Cytoskeleton: Regulation of ATPases by Interaction with Acetylated Tubulin. The FEBS Journal, 275, 4664-4674. DOI:
Dabrowska, S., Andrzejewska, A., Kozlowska, H., Strzemecki, D., Janowski, M., & Lukomska, B. (2021). Neuroinflammation Evoked by Brain Injury in a Rat Model of Lacunar Infarct. Experimental Neurology 336. DOI:
De Boeck, A., Ahn, B. Y., D’Mello, C., Lun, X., Menon, S. V., Alshehri, M. M., Szulzewsky, F., Shen, Y., Khan, L., Dang, N. H., Reichardt, E., Goring, K. A., King, J., Grisdale, C. J., Grinshtein, N., Hambardzumyan, D., Reilly, K. M., Blough, M. D., Cairncross, J. G., & Yong, V. W. (2020). Glioma-derived IL-33 orchestrates an inflammatory brain tumor microenvironment that accelerates glioma progression. Natyre Communications, 11, 4997. DOI:
Ehninger, D., Han, S., Shilyansky, C., Zhou, Y., Li, W., Kwiatkowski, D. J., Ramesh, V., & Silva, A. J. (2008). Reversal of Learning Deficits in a Tsc2+/- Mouse Model of Tuberous Sclerosis. Nature Medicine, 14(8), 843–48. DOI:
Eskelinen, E. L. (2005). Maturation of Autophagic Vacuoles in Mammalian Cells. Autophagy. 1(1), 1-10. DOI:
Forgac, M. (2007). Vacuolar ATPases: Rotary Proton Pumps in Physiology and Pathophysiology. Nature Reviews Molecular Cell Biology, 8, 917–929. DOI:
Giorgi, F. S., Biagioni, F., Lenzi, P., Frati, A., & Fornai, F. (2015). The Role of Autophagy in Epileptogenesis and in Epilepsy-Induced Neuronal Alterations. Journal of Neural Transmission, 122, 849–862. DOI:
Grabherr, M. G., Haas, B. J., Yassour, M., Levin, J. Z., Thompson, D. Z., Amit, I., Adiconis, X., Fan, L., Raychowdhury, R., Zeng, Q., Chen, Z., Mauceli, E., Hacohen, N., Gnirke, A., Rhind, N., di Palma, F., Birren, B. W., Nusbaum, C., Lindblad-Toh, K., Friedman, N., & Regev, A. (2011). Full-Length Transcriptome Assembly from RNA-Seq Data without a Reference Genome. Nature Biotechnology, 29(7), 644–52. DOI:
Guvatova, Z. G., Fedorova, M. S., Vershinina, Y. S., Pudova, E. A., Lipatova, A. V., Volodin, V. V., Gladysh, N. S., Tokarev, A. T., Kornev, A. B., Pavlov, V. S., Bakhtogarimov, I. R., Krysanov, E. Y., Moskalev, A. A., Krasnov, G. S., & Kudryavtseva, A. V. (2021). De Novo Transcriptome Profiling of Brain Tissue from the Annual Killifish Nothobranchius Guentheri. Life 11(2), 1–15. DOI:
Harwood, F. C., Geltink, R. I. K., O’Hara, B. P., Cardone, M., Janke, L., Finkelstein, D., Entin, I., Paul, L., Houghton, P. J., & Grosveld, G. C. (2018). ETV7 Is an Essential Component of a Rapamycin-Insensitive MTOR Complex in Cancer. Science Advances 4(9). DOI:
Hayward, C. S., Kalnins, W. V., & Kelly, R. P. (2001). Gender-Related Differences in Left Ventricular Chamber Function. Cardiovascular Research, 49(2), 340–50. DOI:
Hwang, W., Lang, M. J., & Karplus, M. (2017). Kinesin Motility Is Driven by Subdomain Dynamics. elife, 6, e28948. DOI:
Kilincaslan, A., Kok, B. E., Tekturk, P., Yalcinkaya, C., Ozkara, C., & Yapici, Z. (2017). Beneficial Effects of Everolimus on Autism and Attention-Deficit/Hyperactivity Disorder Symptoms in a Group of Patients with Tuberous Sclerosis Complex. Journal of Child and Adolescent Psychopharmacology, 27(4), 383–88. DOI:
Koenig, K. M., Butler, I. J., & Northrup, H. (2008). Regression of Subependymal Giant Cell Astrocytoma with Rapamycin in Tuberous Sclerosis Complex. Journal of Child Neurology, 23, 1238–39. DOI:
Laurent, St. G., Shtokalo, D., Tackett, M. R., Yang, Z., Vyatkin, Y., Milos, P. M., Seilheimer, B., McCaffrey, T. A., & Kapranov, P. (2013). On the Importance of Small Changes in RNA Expression. Methods, 63(1), 18–24. DOI:
Li, J., Yin, W., Jing, Y., Kang, D., Yang, L., Cheng, J., Yu, Z., Pen, Z., L, X., Wen, Y., Sun, X., Ren, B., & Liu, C. (2019). The Coordination between B Cell Receptor Signaling and the Actin Cytoskeleton during B Cell Activation. Frontiers in Immunology, 9, 3096. DOI:
Ma, X. M., & Blenis, J. (2009). Molecular Mechanisms of MTOR-Mediated Translational Control. Nature Reviews Molecular Cell Biology. Nature Reviews Molecular Cell Biology, 10, 307–318. DOI:
Ojeda, L., Gao, J., Hooten, K. G., Wang, E., Thonhoff, J. R., Dunn, T. J., Gao, T., & Wu, P. (2011). Critical Role of PI3k/Akt/GSK3β in Motoneuron Specification from Human Neural Stem Cells in Response to FGF2 and EGF. PLoS ONE, 6(8), DOI:
Omelyanchuk, N. A., Wiebe, D. S., Novikova, D. D., Levitsky, V. G., Klimova, N., Gorelova, V., Weinholdt, C., Vasiliev, G. V., Zemlyanskaya, E. V., Kolchanov, N. A., Kochetov, A. V., Grosse, I., & Mironova, V. V. (2017). Auxin Regulates Functional Gene Groups in a Fold-Change-Specific Manner in Arabidopsis Thaliana Roots. Scientific Reports 7(1). DOI:
Robinson, M. D., McCarthy, D. J., & Smyth, G. K. (2009). EdgeR: A Bioconductor Package for Differential Expression Analysis of Digital Gene Expression Data. Bioinformatics, 26(1), 139–40. DOI:
Ruigrok, A. N. V., Salimi-Khorshidi, G., Lai, M. C., Baron-Cohen, S., Lombardo, M. V., Tait, R. J., & Suckling, J. (2014). A Meta-Analysis of Sex Differences in Human Brain Structure. Neuroscience and Biobehavioral Reviews. Neurosci Biobehav Rev., 39, 34-50. DOI:
Sato, A. (2016). MTOR, a Potential Target to Treat Autism Spectrum Disorder. CNS & Neurological Disorders - Drug Targets, 15(5), 533–43. DOI:
Saxton, R. A., & Sabatini, D. M. (2017). MTOR Signaling in Growth, Metabolism, and Disease. Cell. Cell Press, 68(6), 960-976. DOI:
Scheffer, I. E., Heron, S. E., Regan, B. M., Mandelstam, S., Crompton, D. E., Hodgson, B. L., Licchetta, L., Provini, F., Bisulli, F., Vadlamudi, L., Gecz, J., Connelly, A., Tinuper, P., Ricos, M. G., Berkovic, S. F., & Dibbens, L. M. (2014). Mutations in Mammalian Target of Rapamycin Regulator DEPDC5 Cause Focal Epilepsy with Brain Malformations. Annals of Neurology, 75(5), 782–87. DOI:
Sharma, E., Jain, M., & Khurana, J. P. (2019). Differential Quantitative Regulation of Specific Gene Groups and Pathways under Drought Stress in Rice. Genomics, 111(6), 1699–1712. DOI:
Takahashi, J. S. (2017). Transcriptional Architecture of the Mammalian Circadian Clock. Nature Reviews Genetics, 18, 164–179. DOI:
Yoo, Y. M., Jung, E. M., & Jeung, E. B. (2019). Rapamycin-Induced Autophagy Decreases Myf5 and MyoD Proteins in C2C12 Myoblast Cells. Toxicology in Vitro, 58, 132–41. DOI: 10.1016/j.tiv.2019.03.025
Copyright information

This work is licensed under a Creative Commons Attribution-NonCommercial-NoDerivatives 4.0 International License.
About this article
Publication Date
21 January 2022
Article Doi
eBook ISBN
978-1-80296-954-2
Publisher
European Publisher
Volume
1
Print ISBN (optional)
-
Edition Number
1st Edition
Pages
1-333
Subjects
Biotechnology, ecology, water, toxicants, nature management
Cite this article as:
Vershinina, Y. S., Krasnov, G. S., Guvatova, Z. G., & Kudryavtseva, A. V. (2022). Change Specifically Responses To Mtor Inhibition Based On Brain Of N. Guentheri. In S. V. Beketov, & I. A. Nikitin (Eds.), Biotechnology, Ecology, Nature Management, vol 1. European Proceedings of Life Sciences (pp. 1-9). European Publisher. https://doi.org/10.15405/epls.22011.1