
Forecasting Electricity Consumption Using Exponential Smoothing Methods


Abstract
Despite being a need for daily living, electricity is a scarce resource. It is crucial to create an appropriate model to calculate the forecasting of power demand that is required by decision-makers. The domestic electric consumption has contributed 20.7% of Malaysia's overall energy consumption in recent years. Because of shifting lifestyles Malaysia's domestic electricity consumption is predicted to rise. Thus, the goal of the current study is to forecast domestic electrical consumption using single-exponential and double-exponential methods. Using prior knowledge, these methods determine the smoothing parameters' values. Applying exponential smoothing techniques and seeing the results demonstrates its efficacy in predicting electricity demand. The excellent models are double exponential smoothing method were selected by identifying the forecast errors with the lowest value. Using mean absolute percentage error (MAPE) and mean absolute deviation (MAD) as forecast accuracy. As an end result, double exponential model offers significant results that indicate it is superior to exponential smoothing methods as a forecasting model.
Keywords: Forecasting, exponential smoothing method, electricity consumption
Introduction
Studying electricity usage, production, and supply is becoming more and more significant for governments, researchers, and corporations due to their unavoidable impact on livelihoods and economic development worldwide (Lee et al., 2022). According to Energy Commission (National Energy Balance, 2019), the domestic sector has contributed 20,7% of Malaysia's overall energy consumption in recent years. Malaysia's domestic power usage is anticipated to increase because of changing lifestyles, rising appliance ownership, and improving economic conditions. Many methods for improving the forecasting ability of existing models have been introduced in recent years. There are varieties techniques for predicting electricity use. The most common models for this purpose are the exponential smoothing techniques, GARCH method, the grey model, and the linear regression models. This study seeks to solve the issue of forecasting home power consumption. electricity domestic usage as to improve management in making future predictions. In contrast to other countries, Malaysian forecasting of energy use is still in its infancy. The goals of this project are to determine the characteristic data and validate the most accurate forecasting model for Malaysia's domestic electricity consumption. The government and management may determine the quantity of anticipated electricity consumption in Malaysia for the future and predict a pattern in Malaysia consistently with the help of this study. Additionally, the top management of the firms will benefit greatly from the information provided by this study to monitor the market's performance. Thus, they can enhance their corporate strategy and raise their company's profit.
Literature Review
Various studies on energy forecasting have already been conducted. It has made a name for itself as one of the most effective forecasting techniques, including Ishak et al. (2022), Shapi et al. (2021), Panigrahi (2020), Akdi et al. (2020) and many more. Ishak et al. (2022) studied the ideal exponential smoothing forecasting model for predicting electricity use in residential sector by using annually data from 1997 to 2018. Their summarised that Holt’s exponential smoothing was shown to be the most suitable model in their research for predicting electricity use in Malaysia. While Shapi et al. (2021) suggested on energy consumption since there are restrictions on the data collection in this study, it is predicted using machine learning that more variables connected to the study's input data should be collected. Future research can also offer hybrid or ensemble approaches because they demonstrate greater accuracy than a single classifier. A study by Panigrahi (2020) predicted residential electricity load demand using learning of various machine learning algorithms, Autoregressive Integrated Moving Average (ARIMA) with Explanatory Variable, Seasonal Autoregressive Integrated Moving Average (SARIMA) with Explanatory Variable for a group of London-based residential customers. Furthermore, the parameter that was explored in this studied were Mean Absolute Percentage Error (MAPE) and root mean square error (RMSE) to test the sensitivity of the results and it is found that both forecast evaluations rendered a lowest value. While Akdi et al. (2020) forecasted daily electricity consumption in Turkey using ARIMA and harmonic regression models for the amounts consumed each day of electricity in Turkey between 2012 and 2016. Researched by Wee Mah and Nanyan (2020) examined results of a few models using four-time exponential series techniques used in Peninsular Malaysia's crude palm oil business. The results indicated that the bivariate models outperformed the univariate models for the production and export of crude palm oil based on the forecast accuracy criteria that were used. AL-Hamad and Qamber (2019) in their article proposed electrical load forecasting utilising three techniques which are the exponential, linear modelling and Neuro-Fuzzy. Maçaira et al. (2015) summarised on Brazil's of domestic electricity use utilising exponential smoothing methods. The Energy Research Company was used to obtain the historical data for each year from 1995 to 2013. The findings showed that the predicted data was accurately matched to the historical data. Studies that use exponential smoothing as a method to forecast domestic electric usage are scarce, according to prior literature. As a result, it is believed to be a suitable method for conducting an exponential smoothing method forecast of Malaysia's residential electricity consumption.
Methodology
The DOSM website provided the monthly electricity usage figures for domestic use from January 2018 to April 2022 that were used in this study. As stated by Hamzah et al. (2018) and Hassani et al. (2015) data is split into two part which are training and testing data to evaluate forecast error using genuine forecasts. This procedure aims to give a trustworthy estimate of how well both types of data are suited by the model in accordance with Hyndman and Athanasopoulos (2018). Models are estimated using training data, while model validation uses testing data. While testing data normally makes up around 20% of the entire amount of data, the amount of training data is approximately 80% according to Tao et al. (2020), Yuan et al. (2018). In this study, the electricity domestic usage is divided into two parts42 training data points between January 2018 and June 2021, and 10 testing data points between July 2021 and April 2022.
Single exponential smoothing and double exponential smoothing are the exponential smoothing techniques employed in this investigation. A forecasting technique known as the single exponential smoothing method provides more weight to more distant historical data with a trend and less weight to current historical data. Equation for single exponential smoothing model as in [1].
[1]
The value of come from the previous predicted value. is determined by minimising the squared sum of the forecasting errors. From 0 to 1, a tiny value of is necessary. This low value of suggests that the time series' average level has not changed significantly over time. Double exponential smoothing the expanded approach of a single exponential smoothing approach with a trend. Equation for double exponential smoothing model as in [2].
[2]
[3]
[4]
In this method, and are smoothing constant enclosed by 0 and 1, while is called enduring element. This analysis looks at the time series' intercept when the origin of time is time of . Other than that, is known as trend component. To forecast exponential smoothing methods, mean absolute deviation (MAD) and mean absolute percentage error (MAPE) are used as metrics for evaluating forecasts. The MAPE is a helpful metric for measuring forecast accuracy. Besides that, MAPE is calculated by subtracting the absolute error from the actual data for each time, dividing the result, and averaging the resulting absolute percentage errors. The formula as follow.
[5]
Result and Discussion
In this part, we examine exponential smoothing methods for electricity consumption in Malaysia. The analysis was carried out using two distinct models. The electricity consumption shown in Figure 1.
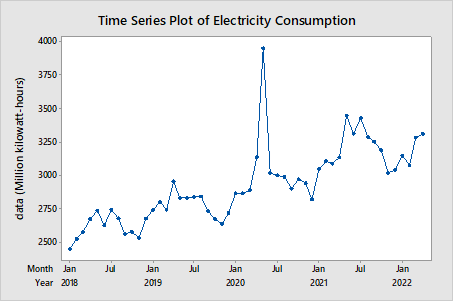
Figure 1 shows the domestic electricity consumption in Malaysia from January 2018 to April 2022 in million kilowatt per hour. Based on the time series plot, data have a trend pattern that are long-term increasing movement indicates that the data is stationary in variance. Whenever the means and variance of a time series are constant throughout time, it is said to be stationary. When analysing data, stationary is crucial for time series forecasting collected through time (Yaziz et al., 2019). Two exponential methods which are single exponential smoothing and double exponential smoothing has been utilised to choose the top models. The findings and analysis for forecasting electricity consumption in Malaysia are thoroughly detailed in this section, and Minitab software was used for all calculations. Figure 2 illustrates the plot for single exponential smoothing method for training data from January 2018 to June 2021.
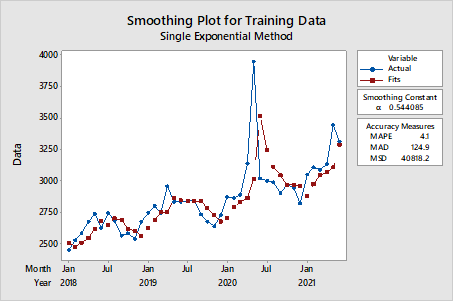
Figure 2 shows that the real and fitted data for electricity consumption in Malaysia for training data. Hence, the patterns of the real and fitted data are comparable. The smoothing constant combines the advantages of real changes with those of smoothing random variations. The formula for the smoothing constant is minimising sum square error given by . MAPE shows 4.1% of forecast error and MAD 124.9.
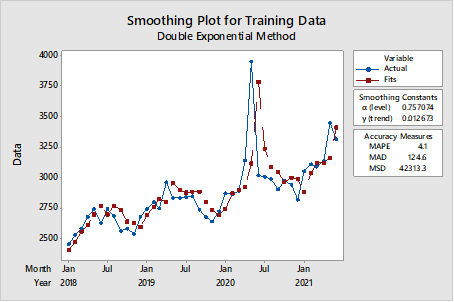
The smoothing plot for the double exponential approach for training data from 2018 to 2021 is tabulated in Figure 3. Double exponential smoothing method is a method with two-constant linear exponential smoothing. Higher values of the smoothing constant are applied when the underlying average is unstable, while smaller values are used to fix the equation. In this article, the sum square error is minimised in order to estimate the smoothing parameters. Maintaining a constant of level equal to 0.757 and trend equal to 0.012 are used. As can be seen, Figure 3 exemplifies forecast evaluation for double exponential method for training data. MAPE shows 4.1% of forecast error and MAD 124.6. As shown on Figure 2 and Figure 3, The optimal model is the double exponential technique since it has lower MAPE and MAD values than single exponential for all forecast evaluation values. The best model to forecast Malaysia's electricity consumption, according to the study of the data, is double exponential smoothing with the minimum error value. The fitted forecast data are produced by this model as test data to confirm exponential smoothing. The evaluation of the forecast was then calculated by comparing the values of the actual and predicted data. Figure 4 displays a time series plot for this dataset.
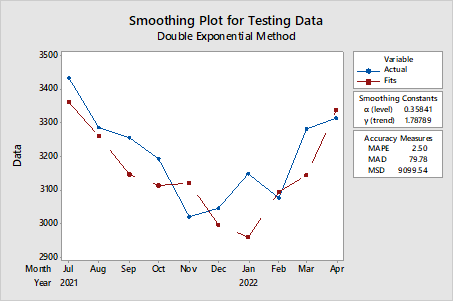
This model generates the fitted forecast data from July 2021 to April 2022 as testing data to validate the best method for exponential smoothing. Consequently, Actual and fitted values were compared to compute the evaluation of forecast. Figure 4 shows graph of actual and fitted data for July 2021 to April 2022 using double exponential method. The actual data shows that number of electricity consumption a bit higher compared to fitted data. Furthermore, values of MAPE and MAD are lowered suggesting that this is the best method to forecast electric consumption in Malaysia.
Conclusion
Electricity is one of the most crucial measures of both the quality of life and the economy of a nation. When developing economic planning, electricity consumption forecasts are essential. This study examines electricity consumption using a monthly data collection. Regarding the study's goals and objectives, it is possible to say that double exponential method is the best method for electricity consumption forecasting based on lowest prediction evaluation accuracy in comparison to single exponential. Additionally, this study's goals include identifying the characteristic data. With the guidance of this analysis, it is evident that the data are increasing in trend. The authors plan to expand on this work by using the same methods for Malaysia's other energy sectors also, for future research the authors intend to employ several methods in order to fit the official projections.
Acknowledgments
This research is funded by the Pocket Grant 2022 research grant, Universiti Tenaga Nasional.
References
Akdi, Y., Gölveren, E., & Okkaoğlu, Y. (2020). Daily electrical energy consumption: Periodicity, harmonic regression method and forecasting. Energy, 191, 116524.
AL-Hamad, M. Y., & Qamber, I. S. (2019). GCC electrical long-term peak load forecasting modeling using ANFIS and MLR methods. Arab Journal of Basic and Applied Sciences, 26(1), 269-282.
Hamzah, D. I. A., Nor, M. E., Saharan, S., Hamdan, N. F. M., & Nohamad, N. (2018). Malaysia tourism demand forecasting using Box-Jenkins approach. International Journal of Engineering & Technology, 7(4.30), 454-457.
Hassani, H., Webster, A., Silva, W. S., & Heravi, S. (2015). Forecasting U.S. Tourist Arrivals Using Optimal Singular Spectrum Analysis. Tourism Management, 46, 322-335.
Hyndman, R. J., & Athanasopoulos, G. (2018). Forecasting: principles and practice. OTexts.
Ishak, I., Othman, N. S., & Harun, N. H. (2022). Forecasting electricity consumption of Malaysia’s residential sector: Evidence from an exponential smoothing model. F1000Research, 11(54), 54.
Lee, M., Ser, Y., Selvachandran, G., Thong, P., Cuong, L., Son, L., Tuan, N., & Gerogiannis, V. (2022). A Comparative Study of Forecasting Electricity Consumption Using Machine Learning Models. Mathematics, 10(8), 1329.
Maçaira, P. M., Souza, R. C., & Oliveira, F. L. C. (2015). Modelling and forecasting the residential electricity consumption in Brazil with Pegels exponential smoothing techniques. Procedia Computer Science, 55, 328-335
National Energy Balance. (2019). Suruhanjaya Tenaga (Energy Comission): Putrajaya, Malaysia.
Panigrahi, A. (2020). Forecasting Residential Electricity Load Demand using Machine Learning [Doctoral Dissertation]. Dublin, National College of Ireland.
Shapi, M. K. M., Ramli, N. A., & Awalin, L. J. (2021). Energy consumption prediction by using machine learning for smart building: Case study in Malaysia. Developments in the Built Environment, 5, 100037.
Tao, H., Al-Sulttani, A. O., Salih Ameen, A. M., Ali, Z. H., Al-Ansari, N., Salih, S. Q., & Mostafa, R. R. (2020). Training and testing data division influence on hybrid machine learning model process: application of river flow forecasting. Complexity, 2020.
Wee Mah, P. J., & Nanyan, N. N. (2020). A comparative study between univariate and bivariate time series models for crude palm oil industry in peninsular Malaysia. Malaysian Journal of Computing (MJoC), 5(1), 374-389.
Yaziz, S. R., Zakaria, R., & Suhartono. (2019). ARIMA and Symmetric GARCH-type Models in Forecasting Malaysia Gold Price. In Journal of Physics: Conference Series (Vol. 1366, No. 1, p. 012126). IOP Publishing.
Yuan, J., Farnham, C., Azuma, C., & Emura, K. (2018). Predictive artificial neural network models to forecast the seasonal hourly electricity consumption for a University Campus. Sustainable Cities and Society, 42, 82-92.
Copyright information

This work is licensed under a Creative Commons Attribution-NonCommercial-NoDerivatives 4.0 International License.
About this article
Publication Date
18 August 2023
Article Doi
eBook ISBN
978-1-80296-963-4
Publisher
European Publisher
Volume
1
Print ISBN (optional)
-
Edition Number
1st Edition
Pages
1-1050
Subjects
Multi-disciplinary, Accounting, Finance, Economics, Business Management, Marketing, Entrepreneurship, Social Studies
Cite this article as:
Megat Muainuddin, M. M. A., & Abu, N. (2023). Forecasting Electricity Consumption Using Exponential Smoothing Methods. In A. H. Jaaffar, S. Buniamin, N. R. A. Rahman, N. S. Othman, N. Mohammad, S. Kasavan, N. E. A. B. Mohamad, Z. M. Saad, F. A. Ghani, & N. I. N. Redzuan (Eds.), Accelerating Transformation towards Sustainable and Resilient Business: Lessons Learned from the COVID-19 Crisis, vol 1. European Proceedings of Finance and Economics (pp. 320-326). European Publisher. https://doi.org/10.15405/epfe.23081.28