
Stock Valuations and Share Prices of Malaysian Palm Oil Companies


Abstract
The purpose of this research is to study the effect of different valuations on the stock prices of Malaysian palm oil companies. With a sample of 12 palm oil companies listed in Bursa Malaysia, a regression analysis was conducted to observe the effect of PE ratio, PB ratio, and EV to EBITDA on the share price of the companies. The results show that small palm oil companies were generally more affected during COVID-19 than large palm companies in terms of its share price. For both large cap and small cap sample, PB ratio has a positive and significant influence on the share prices before the pandemic. During COVID-19, PE ratio and PB ratio have a positive and significant influence on the large-cap share prices, and only PB ratio remains to have a positive and significant effect on share prices of small-cap stocks during the pandemic. Meanwhile, EV to EBITDA has no effect on large-cap share prices before and during the pandemic. Overall, PB ratio is the best indicator to look at even during tough times such as during the COVID-19 pandemic.
Keywords: Stock valuations, palm oil, Covid-19
Introduction
The COVID-19 pandemic was unprecedented, and it interrupted the global economy, politics, society, and finance structures. The public and private segments of the global economy were affected by the speed and scale of COVID-19 impact and had brought major uncertainty in company performance in any given sector (Golubeva, 2021). The crisis of COVID-19 had also contributed to the decline in prices of commodities and exchanges at the beginning of 2020 (Council of Palm Oil Producing Countries, 2020). The whole world went in total lockdown to control the spread of the virus, and this affected the supply and demand curves all over the globe. Malaysia’s first outbreak of the virus was in March 2020, and it had led to the country’s first total lockdown – the movement control order (MCO) – from 18 March to 31 March that year (Lee et al., 2020). All sectors were restricted from operating, and as a result, many became unemployed and lost their main source of income while still having unpaid debts and families to feed. According to Human Resources Minister Datuk Seri M. Saravanan, 99,696 Malaysians have lost their jobs since the MCO was enforced on March 18 and until November 27 in 2020 (Surendran, 2021).
Malaysia is known to be the second largest palm oil producer in the world. Alongside Indonesia, both nations account for about 85 percent of the global supply (Mason & McDowell, 2020). Since more than 90 percent of Malaysia’s supply is being exported, the sector is among the top contributor in bringing foreign income into the country. The palm oil sector supports at least 2 million employment opportunities (Zulqarnain et al., 2020) and contributed a total export worth RM67.55 billion in 2019 (Hirschmann, 2021). That is equivalent to about 4.5% of Malaysia’s GDP that year. Not only the sector is a major contributor to the country’s GDP, but it also helps relief poverty as well as reduce the income gap in the country. Under the FELDA land resettlement schemes to cultivate oil palm, the poverty rate was reduced from 50 percent amongst palm oil smallholders in the 1960s to just 5 percent in 2020 (Rahman, 2020).
Before the COVID-19 pandemic, the global consumption of palm oil was already rapidly increasing as it was needed to meet the demand for food, cosmetics, oleochemical, and oil products as the world population grew (Tapia et al., 2021). Oil palm has the most potential in catching up to meet the rising global demand for vegetable oil because of its significant differences in productivity compared to other oil crops (Hassan et al., 2020; Qaim et al., 2020). However, sustainability has been a key issue in the palm oil industry that had led to Malaysia’s loss of dependency on western countries such as the European Union (EU). Since the hit of COVID-19, the demand for biofuel had weakened, but the global demand for palm oil in general further increased as it did multiply the demand for packed foods such as instant noodles in China, and hand soaps and sanitizers due to more personal hygiene awareness on a global scale (Azian et al., 2020). Hence, as a world’s top producer, Malaysia has a pivotal role in meeting that demand.
Problem Statement
What was supposed to be the backbone of Malaysia’s economy especially during crises turned out to be a deteriorating support as the country continue to struggle in its battle with the virus. The supply side was affected negatively due to the decrease in productivity. In 2020, the total export had reached its highest which exceeded RM70 billion (Shah, 2021) but its contribution to GDP went down to about 3.5%. The total palm oil production in 2020 was expected to surpass the amount in 2019 but instead recorded a decline, worsen by the global lockdowns and the MCO that had restricted international trades and movements across state borders, respectively.
The supply side was disrupted due to severe restrictions in activities such as harvesting, processing, and transporting, and the decline in production was reflected in the period from March until May 2020 (Hassan et al., 2020). With Malaysia’s COVID-19 cases still high, restriction on travel continues and though the economy is in recovery, productivity growth is still weak. Wan Zawawi Wan Ismail, the Malaysian Palm Oil Council (MPOC) chief executive officer, shared that the country’s crude palm oil production is expected to grow only slightly after the first half of 2021 due to movement restrictions between states and a shortage of labours (Chu, 2021).
Malaysia’s palm oil sector is heavily supported by foreign workers, which makes up about 70 percent of its labours (CPOPC, 2020). Back in May 2020, as travels between states were restricted and recruitment was held back, the oil palm plantations were short of roughly about 500,000 workers, according to Reuters (Azian et al., 2020). The global demand for palm oil started to improve in the second half of 2020 as lockdowns were lifted and many businesses started to reopen and need to restock on their edible oils (New Straits Times Business, 2020). However, the shortage of labour had led to crop losses and a further decrease in palm oil supply considerably and causing global demand to outpace global supply. Malaysian exports were reported to have declined to 17.37 million metric tonnes in 2020 from 18.47 million metric tonnes in the previous year (Azian et al., 2020).
The reduction in palm oil production that year may have cost Malaysia to lose about 781 million US dollars, according to Statista’s average price for palm oil for the year 2020 (O’Neill, 2021). The movement restrictions were also damaging to the independent small farmers due to their limited support of seeds, fertilizers, and labour as well as their dependency on middlemen in collecting their ripe fruit harvests to get them marketed, and farmers’ markets, mills, and the processing facilities for the oil palms were not allowed to operate (Rahman, 2020). When their crops are not bringing in earnings, the impact on independent smallholders is putting their livelihoods at risk. All these implications and struggles, especially with the uncertainty due to the pandemic that had currently extended Malaysia’s lockdowns, may had an effect on investors – either having an optimistic or pessimistic view – and may even be reflected on palm oil companies’ share prices.
In November 2020, a large-cap palm oil stock, FGV Holdings, was in the top 50 list that exceeded investment analysts’ target price, according to Bloomberg’s data (Lin, 2020a). Investors’ interest in the palm oil stock such as FGV Holdings may be due to a more optimistic outlook of the sector, where in the next six months of 2021, production of palm oil is expected to improve with the anticipated rainfall and better crop management (CPOPC, 2020). In addition, Indonesia’s recent change in tax structure on exports is said to make their supply of palm oil to be relatively more expensive and may shift the demand for crude palm oil to Malaysia (Hassan et al., 2020).
Imran Yassin Yusof, the head of MIDF Amanah Investment Bank Bhd research, said that plantation stocks are being undervalued by investors because with the high CPO prices, plantation stocks are likely to be profitable in earnings, which could lead to a revaluation trigger (Khuen, 2021). On the other hand, not all palm oil stocks seemed to be thriving. Sime Darby Plantations, which is another large-cap palm oil stock, was listed among those that were traded below its three-year average in terms of price-to-earnings (PE) ratio (Lin, 2020a).
According to a study by Lee et al. (2020), plantation was reported as the only sector in Malaysian stock exchange that did not have a major negative impact of COVID-19. With the optimistic outlook in the plantation sector but with Malaysia’s high number of COVID-19 cases and travel restrictions between states, and the contrast in trends of palm oil stocks, some questions were raised: Are small palm oil companies more affected during COVID-19 than large palm oil companies? How are investors valuing these stocks during COVID-19?
As the stock market started to lose foreign investors at the start of the pandemic, local investors have been the mass and saviors of the market (Tan, 2020). The sector has been resilient in carrying the country during tough periods such as the 1997/1998 financial crises (Hussein et al., 2017). History has shown the importance of supporting and sustaining the sector, though uncertainty is still present. Uncertainty can bring opportunities, but it also carries risks to investors, which in turn will affect their returns. Hence, it is important for investors to do a valuation of stocks, especially to determine whether they are worth to invest. Thus, this research will investigate whether small palm oil companies are more vulnerable than large palm oil companies during the pandemic in terms of the share price. It will also observe whether different valuations of Malaysian palm oil companies significantly affect stock prices during COVID-19 compared to pre-pandemic.
Research Questions
The research and analysis would descriptively clarify a few questions namely (i) Are small palm oil companies more affected before and during COVID-19 than large palm oil companies in terms of its share price? and (ii) Do different valuations significantly affect share prices of Malaysian palm oil companies during COVID-19 compared to pre-pandemic?
Purpose of the Study
The research and analysis attempt to (i) compare whether small palm oil companies’ share prices are more affected before and during COVID-19 than large palm oil companies and (b) observe whether the different valuations affect share prices of Malaysian palm oil companies during COVID-19 compared to pre-pandemic.
Research Method
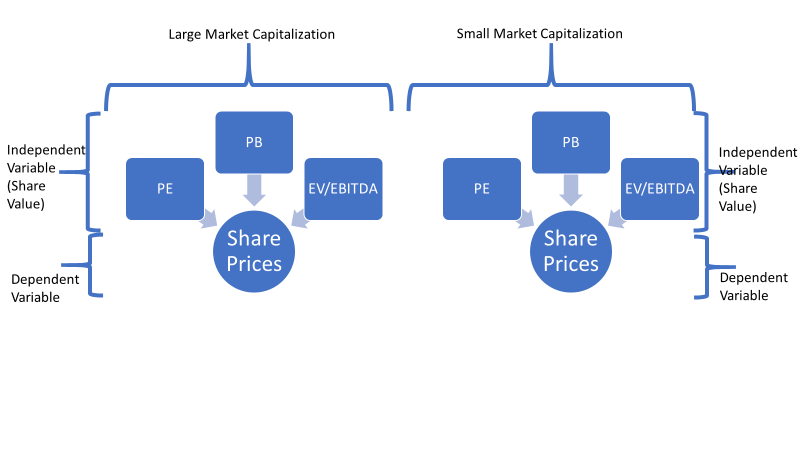
This study involves a correlational research design to describe the statistical relationship between the independent and dependent variables built on a quantitative approach. There will be two models for this study to observe the small cap and large cap stocks separately. The variables in this study are shown below (see Figure 1):
Population and sample
This study uses a non-probability sampling technique which is purposive sampling, where 12 stocks had been sampled that constitute at least 80% of the palm oil market capitalization represented by six small-cap stocks and six large-cap stocks and are also MSPO-certified. This study is longitudinal research that will examine the relationship between different valuations and share prices. In order to capture the stocks’ data pre- and during the Covid-19 pandemic, the sample period is set up from the first quarter of 2019 until the second quarter of 2021. The pre-pandemic period is from the first quarter of 2019 until the first quarter of 2020, while the pandemic period is from the second quarter of 2020 until the second quarter of 2021 Below is the list of the company in the sample.
Data source & collection method
For this research, the data collected are from secondary sources because the data needed for every quarter of the sample period can be extracted from TradingView (tradingview.com). The data collected include the stock’s share price, price-to-earnings (PE) ratio, price-to-book (PB) ratio, and enterprise value to earnings before interest, tax, depreciation and amortization (EV to EBITDA).
Since shares of a stock are bought and sold at different prices in a day, the share price of each quarter is represented by the mean volume-weighted average price (VWAP) of each trading day during for quarter. As for PE ratio and PB ratio, the figures of each quarter are represented by the mean ratios of each trading day during the quarter. Meanwhile, EV to EBITDA is represented by the values reported at the end of each quarter.
Data measurement
There are two types of important variables which are independent and dependent variables. There are three independent variables (which represent the share value) for the regression analysis, which are price-to-earnings (PE) ratio, price-to-book (PB) ratio, and enterprise value to earnings before interest, tax, depreciation, and amortization (EV to EBITDA) of the stocks in the sample. Meanwhile, the dependent variable is the stocks’ share prices. Since share price is in Malaysian Ringgit, this variable had been converted into natural logarithm for the data to be standardized with the remaining data that are already in unit ratio.
The dependent variable in this study is the stocks’ share price. It is important to understand the effect on share price as it may reflect a firm’s overall financial health. It gives an impression to investors of a firm’s future ability to earn and grow profits (Murphy, 2021). The details of independent variables are (i) PE ratio (Share price / earnings per share), (ii) PB ratio (Market price per share / book value per share), and (iii) EV to EBITDA (Enterprise value (Market Capitalization + Total Debt – Cash and cash equivalent) / earnings before interest, tax, depreciation, and amortization). The time series model run is shown in equation below:
SP = βo + β1PE + β2PB + β3EVTOEBIDTA + µ………….large cap
SP = βo + β1PE + β2PB + β3EVTOEBIDTA + µ………….small cap
Research hypotheses
PE ratio
PE ratio is the commonly used equity multiple as it is easily accessible (Fernando, 2021). Investors use this ratio to determine a firm’s relative valuation. Thus, the first hypothesis is as follows:
H1: There is a significant relationship between PE ratio and share price.
PB ratio
PB ratio is appropriate when earnings are primarily driven by assets, which in this case, palm oil firms rely on mills and refineries to process (Fernando, 2021). Thus, the second hypothesis is as follows:
H2: There is a significant relationship between PB ratio and share price.
EV to EBITDA
EV to EBITDA is useful when comparing firms with varying degrees of financial leverage. It also complements PE ratio that does not consider the liabilities of a firm; hence it will give a more comprehensive valuation (Fernando, 2021). Thus, the fourth hypothesis is as follows:
H3: There is a significant relationship between EV to EBITDA and share price.
Findings
This chapter presents the analyses of the research results obtained from the research.
Descriptive analysis (large cap)
As shown in Table 2 and Table 3, the share price curve for the six large cap stocks in the sample seem to move a little to the left and not significantly, where its mean, median, maximum, and minimum value decreased only slightly. Though only slightly, its standard deviation also seemed to decrease from above to below the mean. The mean share prices of companies in the sample declined from RM7.65 before the pandemic to RM7.35, a drop of 4.1%. The median, maximum and minimum share prices dropped by 4.5%, 5.1% and 7.2% respectively during COVID-19.
For its PE ratio curve, there was a significant change in its mean from 68.16 before COVID-19 to 36.06 during COVID-19. This suggests that the average share prices of the companies deteriorated during the pandemic. Though the sample did not outperform pre-pandemic maximum PE ratio valuation, the change in minimum value shows that it did manage to minimize losses during the pandemic period. As for the sample’s PB ratio, there were no significant changes. The PB dived only by 0.2% during the pandemic.
On the same note, the sample’s mean of EV to EBITDA ratio fell significantly from 19.9 before and 13.3 during the pandemic. This could be contributed by a lower share prices of the stocks. Its standard deviation had increased slightly, indicating the dataset is slightly more dispersed compared to pre-pandemic.
Descriptive analysis (small cap)
Based on the Table 4 and Table 5, the average share price for the six small cap stocks in the sample seemed to improve from RM1.67 to RM1.79 during the pandemic. It has increased by 7.0%. With an increased median (by 0.1%), it safe to say at least half the sample’s share prices increased. The finding jives (Switzer, 2010) where author concluded that the small-cap firms tend to outperform large caps over the year subsequent to an economic trough. An abnormal positive performance was observed for US small caps in the recent 2001 economic slowdown.
On the same note, the maximum share prices increased by 0.5% (from RM3.55 to RM4.05) while the minimum fell by 0.2% during the pandemic. As the maximum value increased and minimum value decreased, its range had widened slightly with a more dispersed dataset as the standard deviation increased from pre-pandemic period.
The sample’s EV to EBITDA curve had changed to almost a normal curve compared to pre-pandemic with a median very close to the mean. Its average EV to EBITDA had changed from 14.87 before COVID-19 to 8.94 during COVID-19. A drop of 5.9%. Its range also had narrowed as the maximum value had decreased while the minimum value had remained relatively unchanged. Its standard deviation had decreased, indicating the dataset is slightly less dispersed compared to pre-pandemic.
Multiple regression
Multiple regression is a statistical method for predicting the result of a response variable by using a number of explanatory variables. It involves the modeling linear relationship between the explanatory (independent) factors and response (dependent) variables is the aim of multiple linear regression.
From Table 6, the independent variables in this regression model explain 61.43% and 61.17% of the variability of the changes in share price of the large-cap stocks before and during the pandemic, respectively. This indicates a good level of prediction as it is more than 50%. The remaining 38.57% and 38.83%, respectively, are influenced by factors that are not included in this model. This model is also significant (p < 0.05) with F-ratio of 16.39863 and 16.23031, respectively.
Before the pandemic, only PB ratio has a positive and significant influence on the large cap share prices. Thus, the findings in this model support H2 while fail to reject the remaining null hypotheses. During COVID-19, both PE ratio and PB ratio have positive and significant influence on the large cap share prices, with the latter being a stronger predictor of coefficient 0.1606 compared to PE ratio of 0.0003. However, the impact of PB ratio on the share price had weakened from a coefficient of 0.5206 before the pandemic. Meanwhile, EV to EBITDA has no influence on large cap share price before and during the pandemic. Thus, the findings in this model support H1 and H2, and fail to reject the null hypotheses for H3.
From Table 7, the independent variables in this regression model explain 46.12% of the variability of the changes in share price of the small cap stocks before the pandemic, and then increased to 76.92% during the pandemic. This shows that the model improved in its good level of prediction as it is increased to more than 50%. The remaining 53.88% and 23.08%, respectively, are influenced by factors that are not included in this model. This model is also significant (p < 0.05) with F-ratio of 9.2732 before the pandemic, and 33.2172 during the pandemic. Before and during the pandemic, only PB ratio has a positive and significant influence on the small cap share prices. PB ratio also has a stronger impact during the pandemic compared to pre-pandemic in predicting share price of small cap palm oil stocks in this model as its coefficient increased from 0.7011 to 1.2055. Meanwhile, PE ratio and EV to EBITDA have no influence on small cap share price before and during the pandemic. Thus, the findings in this model support H2 while fail to reject the remaining null hypotheses.
The overall result of this study showed that PB ratio significantly affect share price the most. The ratio itself values tangible assets, which palm oil companies are weighted heavily on such as its plantations, mills, refineries, and process equipment. Meanwhile, share price reflects investors’ perceptions of a company's ability to earn and grow profits in the future (Murphy, 2021). Therefore, it would make sense for it to have positive impact on share price where when PB ratio increases, share price would increase as well. It is safe to say that if investors were to use a valuation to predict the share price of palm oil stocks, PB ratio would be the best option out of the three. It is also important to take note that if PB ratio is more than 1, then share price is said to be overvalued. Nevertheless, when the economy is booming, almost all good stocks have a PB ratio more than 1. PB ratio of companies under an investor’s radar or portfolio should also be compared within the same industry. As for PE ratio, though it did show its significance in affecting share price on large cap stock during COVID-19, it still has as very little impact as 0.0008.
Conclusion and Recommendation
To examine the impact of different valuations on share price of palm oil stocks listed in Bursa Malaysia before and during COVID-19 as well as compare the difference between large and small cap stocks, this research had sampled 12 palm oil stocks. The large cap and small cap are represented by six stocks each and the sample represented at least 80% of Malaysia’s palm oil market capitalization.
The results showed that the range of share prices for large cap stocks had stayed the same with the dataset less dispersed, meaning the gap between each share price of the large cap sample, on average, had lessen. Meanwhile, the range of share prices for small cap stocks had widened with the dataset more dispersed, meaning the gap between each share price of the small cap sample had increased. This shows that small palm oil companies were generally more affected during COVID-19 than large palm companies in terms of its share price.
In both large cap and small cap sample, PB ratio has a positive and significant influence on the share prices before the pandemic. During the COVID-19, PE ratio and PB ratio have positive and significant influence on the large cap share prices, with the latter being the stronger predictor. However, the impact of PB ratio on the large cap palm oil stock price had weakened compared to pre-pandemic.
Meanwhile, EV to EBITDA has no effect on large cap share prices before and during the pandemic. As for the short cap sample, only PB ratio remains having a positive and significant effect on share prices while PE ratio and EV to EBITDA have no influence on small cap share price during the pandemic. PB ratio also has a stronger impact during the pandemic compared to pre-pandemic in predicting share price of small cap palm oil stocks. It is safe to say that investors who would want to see what makes share prices of palm oil stocks to go up, PB ratio is the best indicator to look at even during tough times such as during the COVID-19 pandemic.
The result of this research is showed that PB ratio has a significant effect on share price. This result is in line with Medyawati and Yunanto (2020) who collected a sample of 11 manufacturing companies listed in the food and beverage industry sector listed on the Indonesia Stock Exchange in 2012-2018, and also support Astuty (2017), who investigated 15 companies listed in the Indonesian Stock Exchange. On the other hand, Kumar (2017) had concluded that in India, PE ratio has a minimal influence on share price in the auto industry. This is in line with this research’s result where PE ratio has a significant effect on large cap pam oil stock during COVID-19 but still being the weaker predictor.
Though this research’s sample of 12 palm oil stocks listed in Bursa Malaysia represents at least 80% of market capitalisation, it is not even half of the 39 palm oil companies in the market. Therefore, a suggestion for future research is to enlarge the sample size for a more accurate representation of the population. Another recommendation is to study the variables affecting share price in other sectors especially those with more intangible assets as PB ratio may not be applicable since the ratio itself is asset-weighted.
Acknowledgments
Please replace this text with context of your paper. This publication is supported by Universiti Tenaga Nasional (UNITEN) through Yayasan Canselor Uniten (Grant No:202210009YCU). Its contents are solely the responsibility of the authors and do not necessarily represent the official views of the university.
References
Astuty, P. (2017). The influence of fundamental factors and systematic risk to stock prices on companies listed in the Indonesian stock exchange. European Research Studies Journal, XX(4A), 230-240.
Azian, A., Kumar, K. S., & Batumalai, T. (2020). Impact of Covid-19 on MPO industry in 2020. Malaysian Palm Oil Council (MPOC). http://mpoc.org.my/impact-of-covid-19-on-mpo-industry-in-2020-a-review/
Chu, M. M. (2021). Malaysia’s palm oil output to rise marginally while exports pick up – state agency. Reuters. https://www.reuters.com/article/us-malaysia-palmoil-idUSKCN2E00S6
Council of Palm Oil Producing Countries (CPOPC). (2020). Palm oil supply and demand outlook report 2021. https://www.cpopc.org/wp-content/uploads/2020/12/2021-PO-SUPPLY-AND-DEMAND-OUTLOOK-REPORT-1.pdf
Fernando, J. (2021). Price-to-earnings (PE) ratio. Investopedia. https://www.investopedia.com/terms/p/price-earningsratio.asp
Golubeva, O. (2021). Firms’ performance during the COVID-19 outbreak: International evidence from 13 countries. Corporate Governance: International Journal of Business in Society.
Hassan, M. I., Mariati, R., & Ng, D. (2020). Overview of the global palm oil sector in 2020 and outlook for 2021. Malaysian Palm Oil Council (MPOC). http://mpoc.org.my/overview-of-the-global-palm-oil-sector-in-2020-and-outlook-for-2021/
Hirschmann, R. (2021). Palm oil industry in Malaysia – Statistics & facts. Statista. https://www.statista.com/topics/5814/palm-oil-industry-in-malaysia/
Hussein, M. E., Siwar, C., & Adham, K. N. (2017). The role of Malaysian palm oil industry in the Malaysian sustainable economic development. International Journal of the Malay World and Civilisation, 5(1), 11-18.
Khuen, L. W. (2021). Cover story: Commodity boom seen capped in 2H, but plantation stocks may play catch-up. The Edge Markets. https://www.theedgemarkets.com/article/cover-story-commodity-boom-seen-capped-2h-plantation-stocks-may-play-catchup
Kumar, P. (2017). Impact of earning per share and price earnings ratio on market price of share: A study on auto sector in India. International Journal of Research – GRANTHAALAYAH, 5(2), 113-118.
Lee, K. Y. M., Jais, M., & Chan, C. W. (2020). Impact of COVID-19: Evidence from Malaysian stock market. International Journal of Business and Society, 21(2), 607-628. https://doi.org/10.33736/ijbs.3274.2020
Lin, W. E. (2020a). After blue chip rush, how attractive are the top 100 stocks on Bursa? The Edge Markets. https://www.theedgemarkets.com/article/after-blue-chip-rush-how-attractive-are-top-100-stocks-bursa
Mason, M., & McDowell, R. (2020). Palm oil labor abuses linked to world’s top brands, banks. AP News. https://apnews.com/article/virus-outbreak-only-on-ap-indonesia-financial-markets-malaysia-7b634596270cc6aa7578a062a30423bb
Medyawati, H., & Yunanto, M. (2020). Determinant of stock price manufacturing company: Evidence from Indonesia. Journal of Economics and Business, 3(2), 524-535.
Murphy, C. B. (2021). Why do companies care about their stock prices? Investopedia. https://www.investopedia.com/investing/why-do-companies-care-about-their-stock-prices/
New Straits Times Business. (2020). Demand for palm oil products improves: Affin Hwang. New Straits Times. https://www.nst.com.my/business/2020/11/640155/demand-palm-oil-products-improves-affin-hwang
O’Neill, A. (2021). Average prices for palm oil worldwide from 2014 to 2025. Statista. Retrieved from https://www.statista.com/statistics/675813/average-prices-palm-oil-worldwide/
Qaim, M., Sibhatu, K. T., Siregar, H., & Grass, I. (2020). Environmental, economic, and social consequences of the oil palm boom. Annual Reviews, 12(1), 321-344. https://doi.org/10.1146/annurev-resource-110119- 024922
Rahman, S. (2020). Malaysian independent oil palm smallholders and their struggle to survive 2020. ISEAS Yusof Ishak Institute, 2020(144), 1-16. http://hdl.handle.net/11540/12953
Shah, S. A. (2021). Palm oil export earning to surpass RM70B. The Malaysian Reserve. https://themalaysianreserve.com/2021/01/05/palm-oil-export-earning-to-surpass-rm70b/
Surendran, S. (2021). Surviving the impact of COVID-19: A trying year for job holders. The Edge Markets. https://www.theedgemarkets.com/article/surviving-impact-covid19-trying-year-job-holders
Switzer, L. N. (2010). The behaviour of small cap vs. large cap stocks in recessions and recoveries: Empirical evidence for the United States and Canada. The North American Journal of Economics and Finance, 21(3), 332-346.
Tan, V. (2020). COVID-19 lockdown stimulates Malaysia’s retail investor boom. Channel News Asia. https://www.channelnewsasia.com/news/asia/malaysia-covid-19-lockdown-retail-investor-boom-share-trading-12894640
Tapia, J. F. D., Doliente, S. S., & Samsatli, S. (2021). How much land is available for sustainable palm oil? Land Use Policy, 102(1).
Zulqarnain, Y. M. H. M., Ayoub, M., Jusoh, N., & Abdullah, A. Z. (2020). The challenges of a biodiesel implementation program in Malaysia. Processes, 8(10), 1244.
Copyright information

This work is licensed under a Creative Commons Attribution-NonCommercial-NoDerivatives 4.0 International License.
About this article
Publication Date
18 August 2023
Article Doi
eBook ISBN
978-1-80296-963-4
Publisher
European Publisher
Volume
1
Print ISBN (optional)
-
Edition Number
1st Edition
Pages
1-1050
Subjects
Multi-disciplinary, Accounting, Finance, Economics, Business Management, Marketing, Entrepreneurship, Social Studies
Cite this article as:
Noramiza, N. F., Abdullah, Z., & Ismail, N. (2023). Stock Valuations and Share Prices of Malaysian Palm Oil Companies. In A. H. Jaaffar, S. Buniamin, N. R. A. Rahman, N. S. Othman, N. Mohammad, S. Kasavan, N. E. A. B. Mohamad, Z. M. Saad, F. A. Ghani, & N. I. N. Redzuan (Eds.), Accelerating Transformation towards Sustainable and Resilient Business: Lessons Learned from the COVID-19 Crisis, vol 1. European Proceedings of Finance and Economics (pp. 241-253). European Publisher. https://doi.org/10.15405/epfe.23081.20