
OLAP Concept as a Basis for Business Analysis of Multidimensional Data Structures


Abstract
This paper reveals the concept of an OLAP technology stack for solving problems of Big Data multidimensional analysis as applied to business process reengineering of operational and tactical management of an organization based on incoming information about the current state of the external and internal environment of the organization. The description of the technology, its modifications, as well as the possibilities of the technology and application cases are given. OLAP technology allows you to quickly demonstrate the necessary aggregated indicators to the user, i.e., forms a certain data structure at the request of each user. The payment for the efficiency of providing aggregated data is the need for disk space, where additionally generated data tables will be stored. It should also be noted that the MDX language is considered as the query language for the hypercube data, not the SQL language, since it is the most suitable for working with multidimensional data structures. Application areas of OLAP technology are BI-systems, CRM-systems, and organization management systems.
Keywords: OLAP, hypercube, FASMI, multidimensional structure, analytics
Introduction
Large organizations currently apply several thousand management decisions daily. Expansion of production capacities and the market for sales of goods and services; interaction with a variety of contractors; versatile management of employees; servicing multiple obligations; mutual integration with many other market entities; servicing multiple customers, not only in response to requests for work and services, but also in after-sales service; reputation management; brand management is only part of the directions of development of organizations that increase the number of decisions made, and, consequently, increase the volume of information flows necessary for managers to effectively manage within the areas of professional responsibility.
Hajj-Hassan et al. (2018) note that the received information is becoming more and more heterogeneous; the consideration of indicators requires more and more inclusion of additional information for a comprehensive analysis. Deming (2021) indicates that at the same time, the admissible decision-making time is preserved, and often even reduced.
Problem Statement
Machado et al. (2019) consider that the problem of the rapid increase in the volume of heterogeneous information necessary for making managerial decisions served as a trigger for the search for a technology that allows you to quickly process the summarized information coming from different sources (including geographically remote) and bring it to decision makers in convenient form with the possibility of detailing the received information.
The main problem of obtaining analytical indicators for organization’s managers in this paper is the speed of obtaining such information. The problem is related to a number of features:
- A large amount of initial data in the used databases. Initial data is usually stored in database tables used by employees and information systems in work processes, which is why such tables tend to grow constantly.
- Loading of databases by other processes. Similarly, due to the use of databases with initial data not only by managers, but also by their use in work processes, obtaining data as an operation not only queues up for maintenance by the database, but can also fall into complex algorithms for preventing collisions in working with data, which reduces the speed of receiving the requested information.
- Cross queries to different tables and databases. Simple queries to retrieve table data are relatively fast. Franciscus et al. (2018) suggest that compound queries that require a large number of joins and aggregations can significantly increase the load and increase the query time. In addition, data from different sources can come in different formats (for example, a response in the form of a list of objects from the database and data obtained using the Rest API request to external services using XML or JSON formats), which imposes additional requirements on their complex processing.
- The need to apply mathematical operations to the query results. Raw data, as well as data after aggregation, can be valuable, but as a rule, the use of indicator calculations using an established methodology is required. In addition to waiting for the request to be completed, the data must also be processed, which also takes time.
- Data pre-processing. Often, the structure of the initial data may not correspond to the structure used by the mathematical model. Also, the data may contain incorrect values, and the result of the analysis will be distorted, which also requires preliminary analysis and processing using Data Science tools. Fikri et al. (2019) state that such work, as a rule, is taken over by pre-prepared ETL scripts, but their work also takes time.
The described prerequisites are not so significant when performing the operation once. However, since the information has the characteristic of relevance and analytical indicators are requested regularly, such delays can not only lead to the loss of relevance of information, but also force the manager to use even less reliable, but more efficient sources of information, which in turn may affect the quality of decisions made.
Note that analytical indicators for managers of different areas and levels of responsibility are often built on the basis of the same initial data, but in different projections and using different levels of filtering. It is also worth noting that it is not always necessary to update the indicators when accessing them – sometimes the data is updated at certain intervals, and sometimes the relevance of the data can be neglected. For example, the performance indicators of the organization’s contact center are updated by the information system once a day. On the one hand, the calculation of indicators from the initial data is not required for each user request, if the results are saved in the same way once a day. On the other hand, if one or another decision maker needs only indicators calculated based on the results of the week, then the requirements for updating his indicators are limited to this very period.
Research Questions
The following questions were posed during the study:
- How to increase the speed of obtaining analytical indicators for making managerial decisions when working with Big Data?
- How to ensure the relevance of the obtained analytical indicators?
- How to demonstrate different analytics based on user needs?
Purpose of the Study
Patil and Gangadhar (2016) conclude that the answers to these questions will lead us to the development of a concept for the transition from requesting data at the request of the user to requests within periods specified by the frequency of updating information and requirements for relevance, as well as performing all necessary calculations with storing the results of calculations of analytical indicators.
At the same time, a new request for indicators coming from the user (decision maker) does not refer to data sources, but to the storage of already calculated indicators distributed in the context of vectors useful for user analytics. This is exactly what the OLAP concept offers.
Research Methods
OLAP technology is used as the developed concept of working with Big Data. For a more detailed description of the technology, we introduce the concepts of indicators and categories. Indicators are numerical values of quantities calculated using a specific methodology. It can be numerical values, shares, ratios. Categories, in turn, are data vectors that describe the distribution of aggregated indicators by a certain attribute. It can be a fixed list of string values, rank values, geoinformation polygons. For example, if we are interested in the gross profit of a company, then it is an indicator. In this case, the categories can be branches (names, territory of the area of responsibility), types of goods, the sale of which it is due to (name, article, type of goods), the area from the list of areas covered by the company, etc. Categories are needed to be able to compare analytical indicators, studying them in dynamics, factor analysis. It is worth noting that boolean values can act as categories, but are more often required for mathematical calculations of analytical indicators, and dates and times can act both as categories and as indicators after aggregation.
Median et al. (2018) note that OLAP (On-line analytical processing) is a concept that describes the loading and storage of analytical indicators using a specialized intermediate layer (data cube, hypercube) that stores data using a multidimensional structure (MD, Multidimetional representation of data).
The most familiar view for a single slice of a hypercube can be considered the view of a pivot table, inside which numerical indicators are distributed over several categories of a nested structure. Boutkhoum and Hanine (2017) analyse that the technology itself in most of the market has found application in Business Intelligence (BI) systems as the most modern way of reporting. That is why users often do not even think about organizing data transfer from the source to the system itself when reengineering reporting as a channel for receiving management information using BI systems – the technology, as a rule, involves internal storage of data using hypercubes, and the process of setting them up is developed by system suppliers on design stage.
The scheme of operation of this technology is shown in Figure 1.
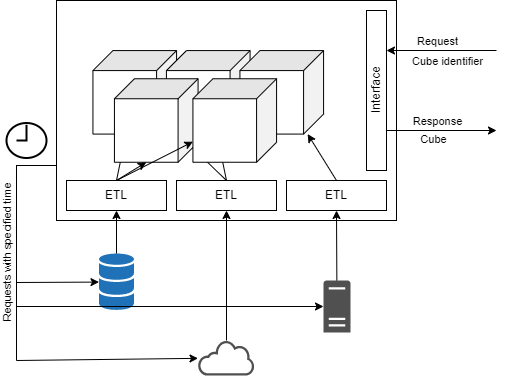
The categories are the dimensions of the multidimensional structure of the hypercube, and the calculated analytical indicators are its elements. The number of categories depends on how deeply you want to detail this or that indicator. At the same time, for different decision makers, the detailing can be not only of different depths (accordingly, with an increase in the depth of detailing, the number of dimensions of the hypercube increases), but also in different sections (using different data as categories). Accordingly, even several users of the same indicator can use only one hypercube, but different cubes can be created for different tasks within the same indicator.
Findings
An example of organizing data storage
To deepen the understanding of OLAP, consider the following case. An organization of mining industry uses a BI system in its activities to monitor analytical indicators used to make management decisions by organization managers. There is a centralized database that collects data on actual production and indicators necessary to predict production opportunities in future periods (exploration data, availability of development equipment in warehouses, work schedule of employees). There are also a number of interfaces Rest APIs counterparties that provide data on predicted demand for an organization’s products. In addition, the HR department of the organization collects information on the number and academic performance of students from the faculties of local universities who carry out educational activities in specialized areas, on the basis of which it is possible to assume the supply of the labor market for planning the expansion of the organization’s staff. It is also possible to obtain accounting data to obtain indicators of the economic activity of the organization. For example, let’s take data only on production and production opportunities.
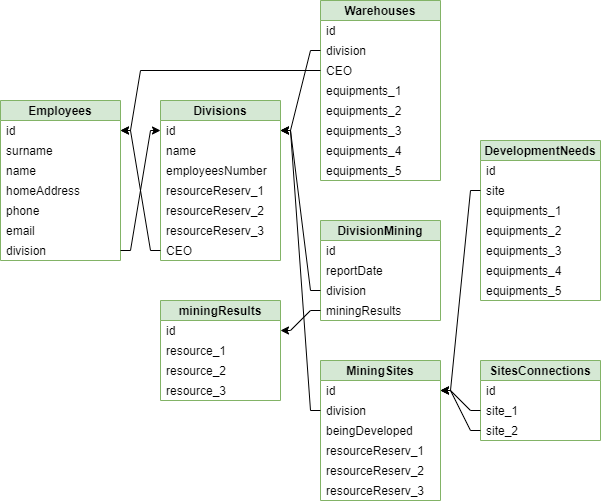
A simplified diagram of the organization’s database is shown in Figure 2. Figure 2 shows that some divisions are assigned warehouses of industrial equipment necessary for the development of a new area (5 types of equipment). You can also see the connections of the division’s parcels – new areas can only be mined if another area is being mined next to them. According to the results of the monthly production, the subdivisions record the production for the period for 3 types of extracted resources.
Suppose who might need this data. For example, when predicting increased demand for extracted resources in excess of the current production capacity, the regional manager must decide to develop new areas of the division. He needs to take into account data on the location of divisions (to optimize the cost of shipping products to the consumer), to have an idea of the availability and need for industrial equipment for development (and the availability of equipment in the warehouses of neighboring divisions), an understanding of the need for new employees when developing a new area.
At this time, it is important for the CEO of the warehouse at the division to compare the available equipment and the quantity that may be required, as well as the availability in other warehouses in order to form requests for the supply of new equipment.
For a regional manager, it is important to understand the level of demand from counterparties by territory with distribution over time, current production capabilities by territory, the possibility of increasing optimal (using the least equipment costs) production capabilities in distribution by enterprises and geographically. The indicators required by him can be presented in the form of tables presented in Figure 3.
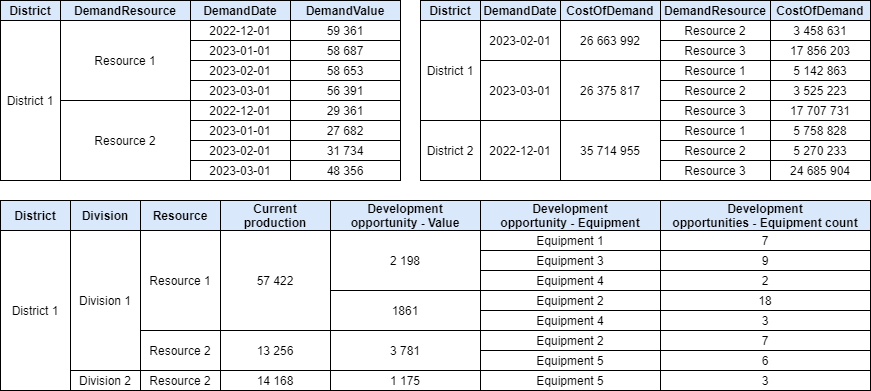
In this form, the data is stored already with the required aggregation, which means that when requesting indicators, we do not need to make new requests to data sources and aggregate them – they were obtained earlier. Next, the data structure describes the levels of detail of indicators. Note that the tables of predicted demand and the cost of products of this demand are quite close in terms of the information stored in them. However, demand is disaggregated by categories Location – Resource – Prediction date, and cost by categories Location – Prediction date – Resource. This is because it may be useful for us to study the predicted demand for a certain resource in dynamics, but the revenue that we receive is more interesting in the distribution by months, and within months already by resources, and depending on the analysis tasks that we set, the order of categories can change.
We also note that the cost of the production volume that satisfies the predicted demand is calculated not only in terms of resources, but also in terms of dates. This approach will be disclosed when describing the MOLAP technology, but if we explain it succinctly, then we do not need to calculate the total cost when considering by months and by resources, both values are stored in a hypercube and issued at the user’s request, reducing the time to process the request.
At the same time, looking at the table of possibilities for expanding production capacities, we can say that for a higher price of received information, it would be possible to calculate separately the share of the ability to meet demand with current capacities, for individual decisions to calculate the percentage of excess production and other indicators. In other words, on its basis, you can form a number of cubes, each of which will carry more useful information.
Also, the example shows that the name “Cube” does not create a requirement for the need to use three categories as dimensions. There can be as many categories as you like, depending on the requirements for detailing information.
After analyzing the tables, we can formulate a number of conclusions that come from Figure 3:
- when a regional manager works with the BI system of an organization, it is not required to make many complex queries to each of the sources, some of which, among other things, are external (predicted demand), three simple queries to the generated hypercubes are enough;
- the received data is brought to a single format, does not require additional operations (for example, obtaining the structure of table records from a JSON string);
- if mistakes occur in the process of loading data from sources, they can either be processed, or, if processing does not occur, do not overwrite the data obtained during the last loading of data from the source;
- a request for obtaining data from sources is made according to the schedule, and not during the user’s session. For example, it doesn’t make sense to upload predicted demand data more than once a month. Some of the data may even be loaded when a certain event occurs, for example, data on the possibility of expanding production remain relevant until the development of a new area has begun;
- now, data storage requires some amount of disk space in addition to the initial data, however using of random access memory has been significantly reduced.
Varieties of OLAP technologies
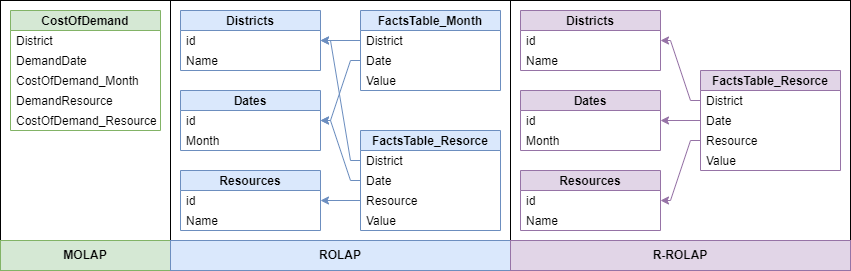
MOLAP (Multidimensional OLAP) is the classic OLAP technology, which, as a rule, is used when it comes to OLAP systems. The principle of data organization is to store indicators and categories within one table. The values of aggregated indicators are stored both in the form of a total value by dimensions, and on the nodes of the hypercube (for each separately used level of detail by category). Figure 3 shows the principle of MOLAP data storage. Nosov et al. (2021) indicate that this solution is considered the most economical in terms of random access memory and, at the same time, the most difficult for permanent memory.
ROLAP (Relational OLAP) is an OLAP system created on the basis of relational databases and storing data in relational tables. The tables within a ROLAP system can be divided into fact tables and dimension tables, linked by a “Snowflake” schema or a “Star” schema. The gist is that dimension tables store sets of values of a particular category, and a fact table stores minimally aggregated data for each combination of categories. Dimension tables are linked to fact tables using an identifier, and data is retrieved using table data join operations.
It is worth noting that the calculation on the nodes of intermediate and top-level dimensions is not stored in a single fact table – data is stored in additional fact tables to store intermediate aggregations. In some sources, a separate type of ROLAP-R-ROLAP (Real-time relational OLAP) is sometimes distinguished. With this approach, intermediate aggregations are not stored in separate fact tables, but are calculated when they are accessed during a user query.
HOLAP (Hybrid OLAP) is a technology that implements both approaches (MOLAP, ROLAP), within which the most convenient of them is determined depending on certain data. Lisenkova and Popov (2018) state that for high-dimensional data with distribution over a large number of categories, it may not be appropriate to process aggregations at query time and the MOLAP concept will be applied, and for data arrays of small dimensions, or for data with a small number of actually used dimensions, ROLAP is much more efficient (Boutkhoum & Hanine, 2017).
Data organization schemes for an example with the total cost of goods that satisfy the demand of counterparties for OLAP varieties are shown in Figure 4.
Using OLAP Structures Data
In view of the possibility of obtaining data from different sources, it is inappropriate to talk about uniform practices for entering data into an OLAP system. However, getting data from a hypercube structure has several characteristics.
First, the hypercube data consumer only needs SELECT queries. There is no need on the part of the user or the BI system to make changes or delete cube records, as well as change the structure of tables (set of columns, data types) and their data schema – these are all tasks of the OLAP engine.
Secondly, the use of OLAP is focused on response speed, so when choosing a technology for a number of parameters, speed usually comes first. The structure of requests and their channels of receipt must also follow this rule.
Considering the query languages for hypercube data, it is worth noting that the most common SQL query language is not the most convenient for working with multidimensional structures. In practice the MDX (Multidimensional expressions) language, which is a modification of the SQL language, is usually used when working with multidimensional data structures. Unlike SQL, MDX works not only with data tuples, but also with sets of tuples (implementing a multidimensional selection). In individual information systems, you can find private solutions in the form of similar modifications of SQL, but usually such information systems still have MDX support.
As a practical application of OLAP technologies, as a rule, people talk about the directions of budget policy, data analytics, as well as the storage of consolidated reporting. Regarding the application of technology in business, they usually cite analytics in the areas of marketing, purchasing and sales, tariff and pricing policy, as well as monitoring as a control tool using threshold values of analytical indicators.
Conclusion
Currently, OLAP technology is widely used in analytics and data consolidation systems. So, in addition to BI systems, OLAP technologies have found application in accounting support programs, organization management systems (for example, r-keeper for managing a public catering organization), and CRM systems. However, BI systems and accounting information systems are still considered to be the largest coverage.
At the same time, the potential of the technology can be called not fully disclosed, since even in those situations where multidimensional data storage is required; more familiar relational databases are often used.
When working with OLAP structures, it is useful to understand the FASMI principle proposed by E.F. Codd, who formulated the concept of OLAP:
- Fast – the OLAP system should generate responses to user requests in a short time (usually no more than 5 seconds);
- Analysis – the system must answer any questions of logical and static analysis in a form accessible to the user;
- Shared – the system must be able to share data by user access levels, ensuring the proper degree of data confidentiality;
- Multidimensional – the system must provide multidimensional representation of data. In addition, support must be provided for dimension hierarchies (for example, year – month – day);
- Information – it is necessary to obtain any information then it is needed for a complete analysis.
It should be noted that the concept of proactive data acquisition has become more often implemented in modern IT projects. However, even now there are IT projects in which user requests for primary data are still being made for reasons of saving disk space.
Acknowledgments
The work was supported by the Ministry of Science and Higher Education of the Russian Federation (Grant No. 075-15-2022-1121).
References
Boutkhoum, O., & Hanine, M. (2017). An integrated decision-making prototype based on OLAP systems and multicriteria analysis for complex decision-making problems. In Applied Informatics (Vol. 4, No. 1, pp. 1-24). Springer. DOI:
Deming, D. J. (2021). The Growing Importance of Decision-Making on the job. Research of National Bureau of Economic Research, working paper 2873. DOI:
Fikri, N., Rida, M., Moussaid, K., & Omri, A. E. I. (2019). An adaptive and real-time based architecture for financial data integration. Journal of Big Data, 6(97), 1-25. DOI:
Franciscus, N., Ren, X., & Stantic, B. (2018). Precomputing architecture for flexible and efficient big data analytics. Vietnam Journal of Computer Science, 5, 133-142. DOI:
Hajj-Hassan, H., Laurent, A., & Martin, A. (2018). Exploiting Inter- and Intra-Base Crossing with Multi-Mapping: Application to Environmental Data. Big Data and Cognitive Computing, 2(3), 25-36. DOI:
Lisenkova, A. A., & Popov, S. G. (2018). Investigation of the time of dynamic generation of MDX queries to multidimensional OLAP cubes. Proceedings of a scientific conference with international participation, 183-185. DOI:
Machado, G. V., Cunha, I., Pereira, A. C. M., & Oliveira, L. B. (2019). DOD-ETL: distributed on demand ETL for near real-time business intelligence. Journal of Internet Services and Applications, 21, 1-15. DOI:
Median, M. H., Schütz, C., & Schrefl, M. (2018). Using superimposed multidimensional schemas and OLAP patterns for RDF data analysis. Open Computer Science, 1(8), 18-37. DOI:
Nosov, A. P., Akhrem, A. A., & Rakhmankulov, V. Z. (2021). Analysis of the efficiency of decomposition of OLAP data hypercubes for methods of exponential computational complexity. Mathematics and Mathematical Modeling, 3, 29-45. DOI:
Patil, A. D., & Gangadhar, N. D. (2016, October). OLaaS: OLAP as a Service. In 2016 IEEE International Conference on Cloud Computing in Emerging Markets (CCEM) (pp. 119-124). IEEE. DOI:
Copyright information

This work is licensed under a Creative Commons Attribution-NonCommercial-NoDerivatives 4.0 International License
About this article
Publication Date
27 February 2023
Article Doi
eBook ISBN
978-1-80296-960-3
Publisher
European Publisher
Volume
1
Print ISBN (optional)
-
Edition Number
1st Edition
Pages
1-403
Subjects
Hybrid methods, modeling and optimization, complex systems, mathematical models, data mining, computational intelligence
Cite this article as:
Sokolov, V. A., Kuzmich, R. I., Stupina, A. A., Ponomareva, K. A., & Pokushko, M. V. (2023). OLAP Concept as a Basis for Business Analysis of Multidimensional Data Structures. In P. Stanimorovic, A. A. Stupina, E. Semenkin, & I. V. Kovalev (Eds.), Hybrid Methods of Modeling and Optimization in Complex Systems, vol 1. European Proceedings of Computers and Technology (pp. 1-10). European Publisher. https://doi.org/10.15405/epct.23021.1